
Analysis: Contradictory coal data clouds China’s CO2 emissions ‘rebound’ in 2022
Lauri Myllyvirta
02.15.23Lauri Myllyvirta
15.02.2023 | 12:01amNew preliminary energy data from the Chinese government suggests there was a 1.3% rebound in the nation’s carbon dioxide (CO2) emissions during 2022. However, separate figures point to a 1% decline.
The discrepancy centres on officialcoal consumption data, which recorded a 3.3% surge in demand during 2022. In contrast, activity in the major coal-consuming sectors ranged from weak growth in coal power (+0.7%), through to declines in output for steel (-2%) and cement (-11%).
Analysis of these trends for Carbon Brief points to zero growth in China’s coal use in 2022, rather than the officially reported 3.3% increase. At the same time, there were falls in demand for oil and gas last year, as well as a significant drop in cement production.
The scale of the uncertainty over the true nature of China’s coal demand means it is hard to establish whether there was an overall rise or fall in the country’s CO2 emissions in 2022. This difference could have global implications for action on climate change.
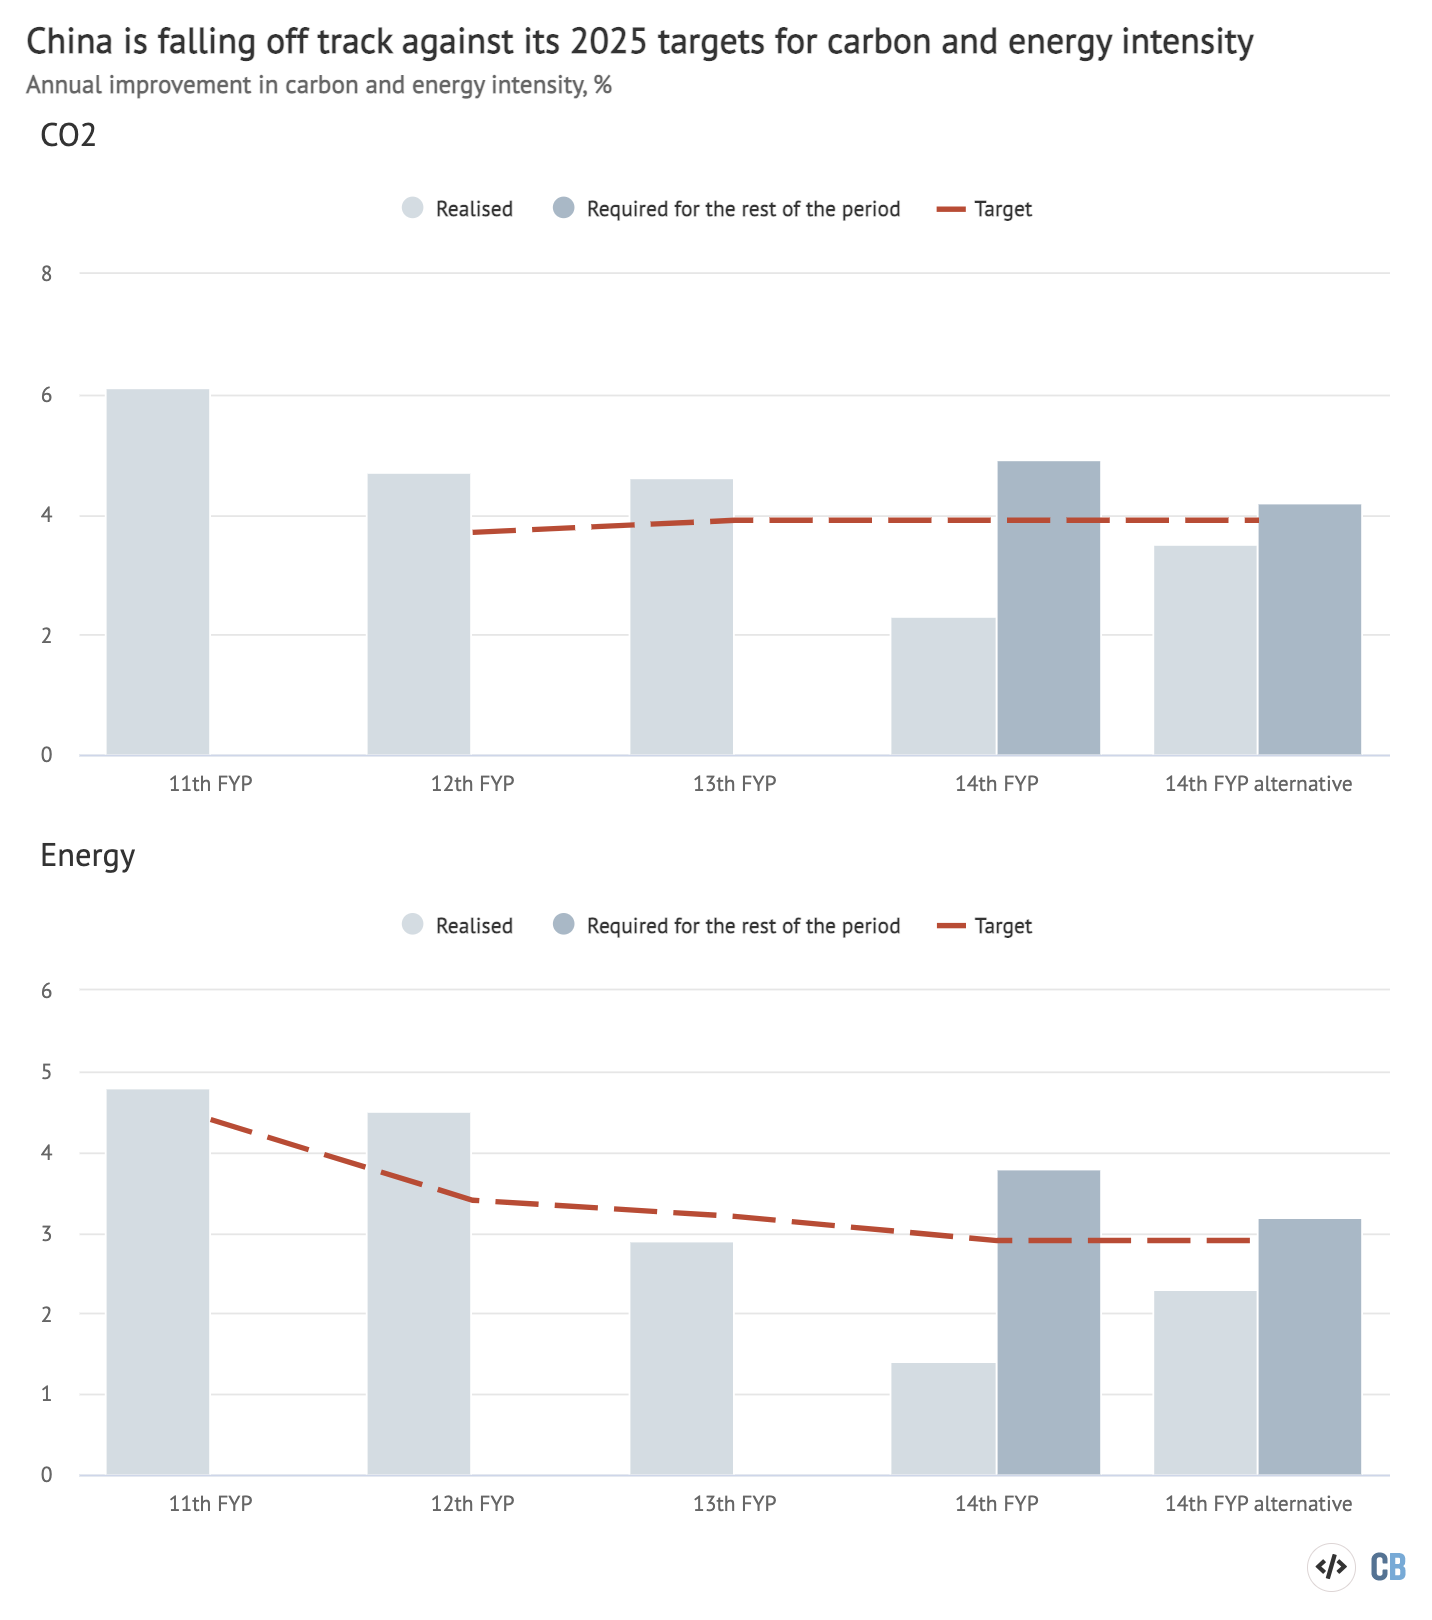
Whether the official coal data for 2022 is correct or not, the country moved further off track against its near-term targets for carbon and energy intensity. These targets from China’s14th five-year plan, first published in 2021, aim to cut the amount of energy and CO2 associated with each unit of gross domestic product (GDP) by 2025.
Given projected increases in GDP, these goals are likely to require near-zero emissions growth after this year, as well as rapid improvements in energy- and carbon-intensity out to 2025.
Structural drivers of emissions decline
China’s CO2 emissions had started to fall in summer 2021, after the surge that followed the first Covid lockdowns in early 2020. This fallcontinuedinto the first half of 2022, extending what had already become thelongest sustained declinein China’s emissions in recent history.
的司机继续排放through the second half of 2022. Real estate and infrastructure construction volumes continued to contract, as shown by fallingconstruction “starts”andcementoutput, low-carbon energy generationgrew rapidlyand strictCovid control policiesaffected activity, particularly emissions from transport.
The contraction in construction and heavy industry accelerated inDecemberwith steel output falling 10%, cement 12% and auto production 17%.
In the real-estate sector, the floor area of new construction startsfell39% in 2022 year-on-year and land sales fell 53%. These reductions are even more dramatic because they took place from a low base – output was already dropping rapidly in December 2021.
In total, the use of oil and gas fell by -0.4% and 1.7% in 2022, compared with the previous year. An important reason for fall in oil use was Covid-19 restrictions, but other factors included reduced freight volumes due to the industrial slowdown, which also affected industrial gas demand.
Gas prices reached record-high levels in 2022 as a result of Russia’s decisions to cut backgas supplyto Europe, starting in summer 2021, and escalating to an almost complete stop of supply after the start of the country’sinvasion of Ukraine. These high prices suppressed Chinese gas use, especially among users who have flexibility to switch between coal and gas.
The slowdown in construction and investment would have been even sharper withoutstimulus measuresthat encouraged state-owned firms to increase their investments in manufacturing capacity and in the power and heat sector.
This investment helped low-carbon technologies record another banner year in 2022, with power generation from wind and solar powerincreasing21% to reach 14% of total electricity demand.
Electric vehicleproductionsaw even more dramatic growth, doubling to 7.2m cars – 26% of all cars sold. Among electric cars, plug-in hybrids gained share from full electric vehicles.
A record 125 gigawatts (GW) of solar and wind capacitywas addedin China in 2022, breaking the previous record from 2020. Of the added capacity, 87GW was solar and 38GW wind.
The added generation equals 2% of China’s electricity demand, meaning that added wind and solar power covered half of demand growth of 3.6%. In fact, the amount of wind capacity connected to the grid came in significantly belowforecastsof 55–70GW for the year, as the Covid epidemic and control policiesaffectedgrid connections.
Coal rebounds on extreme weather
While the growth rate of China’s coal consumption for the whole year of 2022 remains uncertain, it is clear that demand for the fuel rebounded in the second half of the year.
This was caused by the summer’s historic heatwave anddrought, which severely reduced hydropower generation for the rest of the year and caused a short but dramatic jump in electricity demand for air conditioning.
Despite falling industrial energy demand and growing power generation from wind and solar, the drought and heatwave drove a 15%increasein electricity generation from fossil fuels in August and 6% over the entire second half of the year.
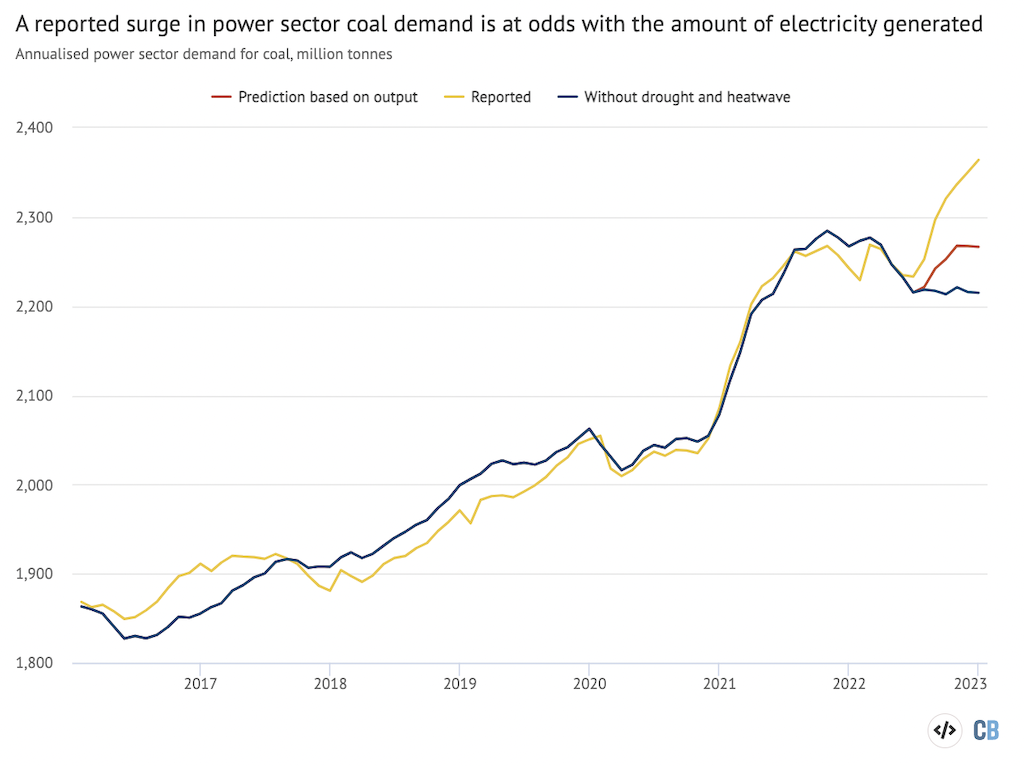
If it had not been for these weather extremes, coal-fired electricity generation would have decreased by approximately 2% year-on-year, instead of increasing by 1%. (See chart in the next section for an illustration of how this would have affected demand for coal.) Similarly, growth in CO2 emissions would have been 1.4 percentage points lower.
The coal-power rebound in the second half of last year had major knock-on effects for China’s coal use overall, because the sector accounts for half of national demand for the fuel. The power sector, in turn, is the second-largest contributor to China’s CO2 emissions.
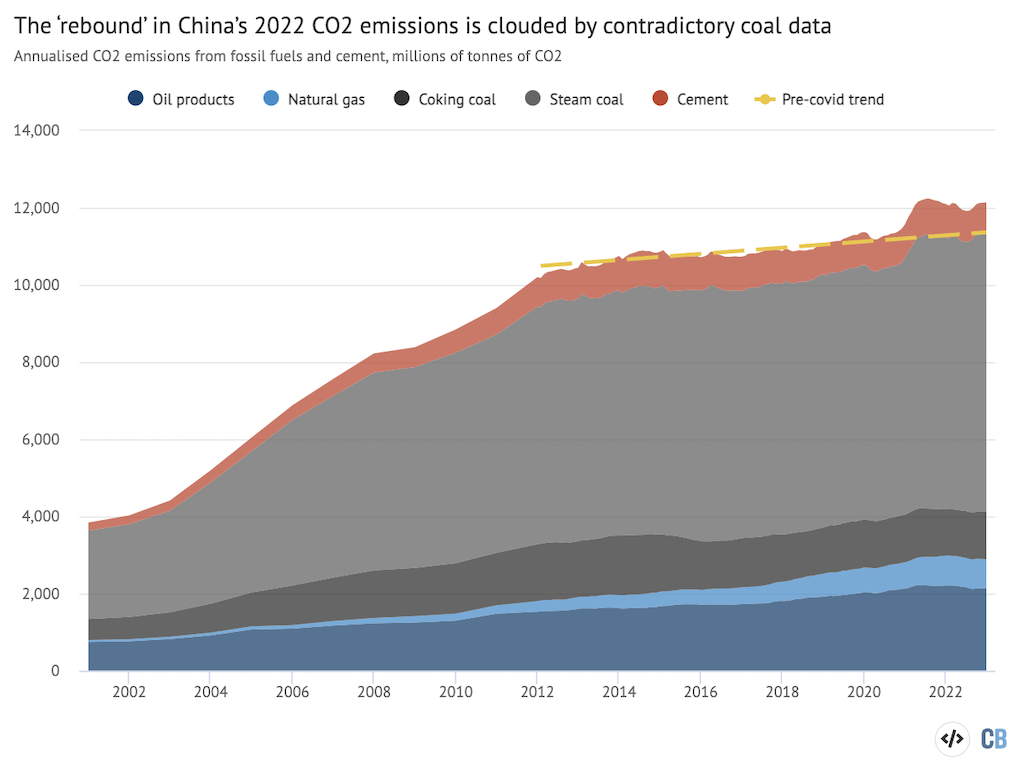
Consequently, despite the ongoing weakness in demand for oil, gas and cement, the officially reported 3.3% increase in China’s coal use points to a 1.3% rise in its emissions in 2022.
This is shown in the figure below, which highlights the role of coal used for electricity generation in pushing up emissions during late 2022. The chart also shows the 2012-2019 pre-Covid trend in emissions.
The 1.3% increase in China’s CO2 emissions implied by the reported surge in coal consumption is at odds with the estimate published by theGlobal Carbon Projectlate last year. The project had estimated a 0.9% decrease in China’s CO2 emissions, including a slight 0.1% fall for coal.
Similarly, theInternational Energy Agency(IEA) hadprojectedas recently as December that China’s coal consumption would rise by only 0.4% in 2022.
Coal data question marks
The officially reported increase in coal demand of 3.3% would, if accurate, mark the first time coal use had grown faster than GDP since 2005, during the heyday of the export boom that followed China’s accession to theWorld Trade Organization.
The question marks over the coal data are compounded by China’s own officially reported figures on industrial output. These show that coal-fired electricity generation rose by only 0.7%, whileoutput fellin the second- and third-largest coal-consuming industries, namely, steel and cement.
One reason why coal consumption could have diverged from power generation and industrial output growth is gas-to-coal switching in industry and households, in response to the high gas prices. However, this can only explain a part of the higher-than-expected coal demand growth rate. Due to their scale, these sectors can only explain up to 1 percentage point of the discrepancy between officially reported coal demand and what is implied by other figures.
Another possibility is that China’s coal-use figures, which are reported in units of energy, have failed to keep up with changes in the amount of energy contained in each tonne of coal.
In the past 18 months, China has been engaged in anaggressive pushto increase domestic coal output, after lagging output caused shortages in summer 2021.
Coal imports have also been eschewed in favour of domestically produced coal, the quality of which has likely deteriorated as miners have scrambled to increase output volumes. This means that users will have to burn more coal to generate the same amount of energy – and CO2 emissions.
If this change in coal quality has not been fully accounted for in the preliminary numbers published by the National Statistics Bureau, then its numbers are going to overestimate coal consumption in 2022, as measured in energy units. This would mean that coal consumption data would likely be revised down as more detailed statistics, which account for the quality of the coal, are compiled.
The impact of this possibility on actual coal consumption in tonnes is shown in the figure below. The yellow line represents officially reported coal use, while the red line shows coal use estimated according to the amount of electricity generated by the sector. The blue line shows how much lower power-sector coal demand would have been without last year’s extreme weather.
On the other hand, it is also possible that coal consumption growth was under-reported during the double-digit expansion of late 2020 to early 2021, when there was a lot ofpressureon local officials to meet energy consumption control targets. This would mean that statistics are playing catch-up to the increase that happened earlier.
Taken together, these other datapoints suggest that China’s coal use may not have grown in 2022 at all, instead recording effectively zero change in demand. If that is the case, then China’s CO2 emissions would not have grown either. In fact, they would have declined by an estimated 1%.
Impacts of reopening
After imposing strict Covid controls through much of 2022, including the Shanghai lockdown in April and widespread lockdowns of neighbourhoods last autumn, the Chinese government removed essentially all controls in late November and early December.
Looking ahead, the big question is whether the lifting of China’s strict Covid controls will cause a new surge in emissions. The answer is less obvious than it seems.
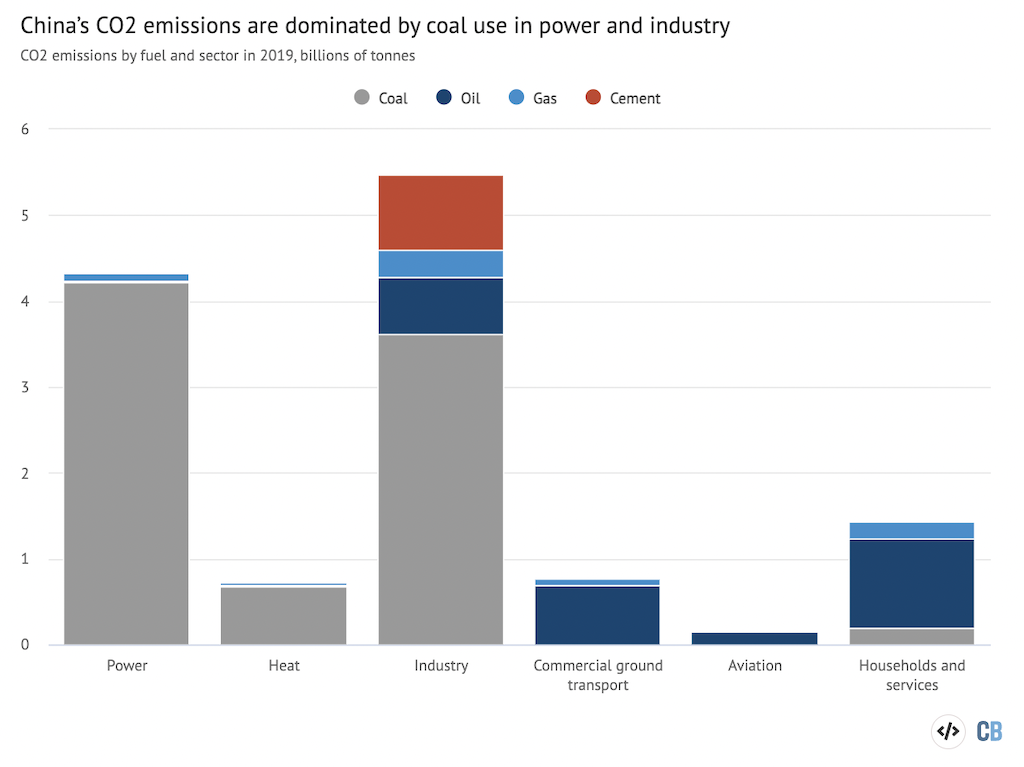
It is true that activity in passenger transport, travel, service-sector energy demand and some other sectors impacted heavily by the Covid policies is alreadyreboundingforcefully. However, these sectors make up a small fraction of China’s total emissions, as shown in the figure below.
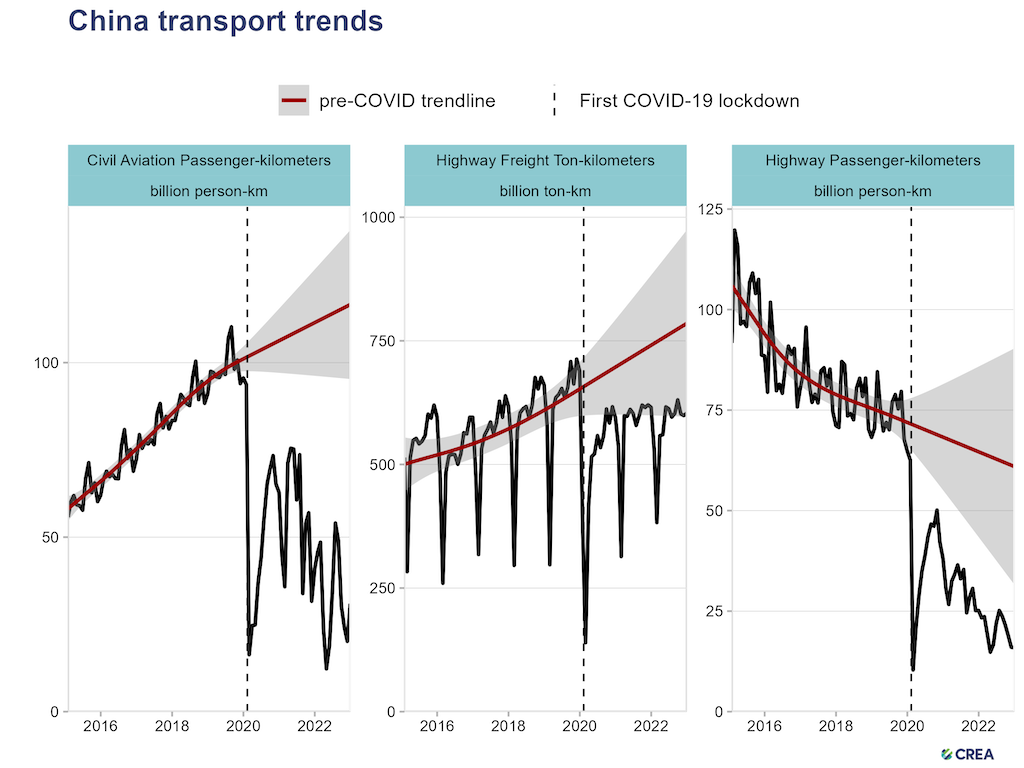
The potential for emissions increases due to reopening is clear in the transport sector.
Aviation fuel (kerosene) consumption was 50% lower in the first 11 months of 2022, compared with 2019, thanks to persistently reduced civil aviation demand shown in the figure below top left.
Gasoline consumption was already higher in 2022 than in 2019, although it fell 1% in 2022. Diesel consumption increased in 2022 compared to both 2019 and 2021, leaving total oil demand higher in 2022 than in 2019. This illustrates that even within the use of transport fuel, industrial and commercial activities often overshadow passenger transport.
Taking all of these into account, China’s consumption of oil products remains 6% below its pre-pandemic trend. If that gap closes, China’s CO2 emissions would increase by about 1.4%. A Reutersyabo亚博体育app下载published last December came to a similar conclusion.
The relatively modest increase is due to the fact that, even before the pandemic, passenger transport was responsible for only around 10% of China’s total CO2 emissions.
Looking to the power sector, low-carbon energy growth is bound to accelerate, with 165GW of new wind and solar capacitytargetedfor 2023 andbidding新的风力涡轮机reachi单独供应合同ng 100GW last year.
As electricity demand growth islikelyto accelerate, however, even this increase will not be sufficient to supply all of the demand growth without increasing power generation from fossil fuels.
More broadly, to understand the full potential effect of China’s reopening on CO2 emissions, it is important to note that emissions overall are well above the pre-Covid trendline, as shown in the figure in the first section, above.
This implies that while zero-Covid caused sharp reductions in activity and emissions in some sectors, especially passenger transport, the net effect of the policy was to increase emissions.
What happened at the beginning of zero-Covid was that the government responded to the economic shock from the lockdowns withmassive stimulusto construction and industry. As household consumption expenditure dropped, manydirectedthe increased savings into real estate, inflating the bubble.
China’s emissions also increased during Covid lockdowns because most other major economies transferredan unprecedented amount of supportto households to boost spending power, while Chinasubsidised manufacturingandcut wages, leading to asurge in exportswhich isnow reversing. As a result, emissions from industry, in particular, are above the pre-Covid baseline.
In the same way that zero-Covid policies counterintuitively caused China’s emissions to increase, it is not automatically the case that reopening will push them still higher.
事实上,reo的影响pening on the heavy industry and construction sectors that dominate China’s emissions is much less straightforward and depends strongly on policy choices.
China’s climate goals
The reported increases in energy consumption and CO2 emissions mean that China has fallen significantly behind on its climate targets for 2025, as set out in its14th five-year plan.
Between 2020 and 2025 the country istargetinga 13.5% reduction in energy intensity, its energy use per unit of GDP. It is also aiming for an 18% reduction in energy sector carbon intensity, its CO2 emissions per unit of GDP.
The latest official figures show China’s GDP only grew by3% in 2022, while energy use increased by 2.9% – including the reported coal surge – and CO2 emissions from energy were up by 2.2%.
This means carbon intensity only fell by 0.8% and energy intensity by 0.1% in 2022. These sluggish improvements come on top of2021 numbersthat included a 4% increase in CO2 emissions and a 4.6% increase in coal consumption.
As a result, China’s CO2 intensity would have to fall rapidly – by 5.1% per year for the next three years – to meet the 14th five-year plan target for 2025.
Even if coal consumption growth in 2022 turns out to be over-reported and is consequently revised down to the levels implied by power and industrial output data, carbon intensity would still need to fall by 4.5% per year over the next three years.
Chinese economists areexpectingGDP growth of 6.5–7.0% this year due to the reopening boost and stimulus policies. This leaves space for emissions to grow at the same time as carbon intensity improves, as long as emissions rise more slowly than GDP.
However, GDP growth is expected to come in at closer to 4-5% per year in 2024 and 2025, meaning that CO2 emissions growth will need to nearly stop or even reverse after this year.
While this might seem challenging in light of reopening, it is not a given that China’s recovery from zero-Covid will mean an increase in emissions, beyond a jump in the demand for transport fuels.
For example, consultancy MySteelexpectslow to no growth in coal demand in 2023. It sees little upside for heavy industry sectors and expects increases in low-carbon energy to cover most of the growth in China’s electricity demand.
The reopening of household consumption, travel and service industries will contribute to economic recovery. Growth in consumption will boost labour-intensive sectors and take care of the political need to create jobs. This could allow the government to unwind the shift to high-emissions sectors that took place during zero-Covid.
Moreover, China’s德mographic shift, with declining fertility and working-age population, also means less pressure to create jobs and less demand for new real estate.
China’s leadershipsaysit wants to prioritise household consumption in the economic recovery. The question is whether the growth in consumption will be fast enough to meet the leadership’s hopes for GDP expansion.
The targeted rate of GDP growth was left open in the current five-year plan, which allows more flexibility, but also makes policy harder to anticipate. An even bigger question is whether the moderation of energy-intensive industries that this approach would entail is politically acceptable.
A major challenge for the consumption-led recovery is that consumer confidence in China isclosely tiedto the property market, as real estaterepresents更大份额的家庭财富比另外一些er major economy.
Local governments, which would have to provide much of the income support and social safety net to enable an increase in spending, have also seen their financesdamagedby the real-estate slowdown. Therefore, the government has beenrelaxingthe policies aimed to rein in real-estate speculation and excessive leverage in the sector.
On the other hand, re-inflating the real-estate market would behard, even if the government wants to do it, as falling real-estate prices disrupt consumer belief in apartments as a surefire investment. Similarly, the weak state of local government finances restricts the ability to use state-led infrastructure and industrial projects to boost growth.
It is clear that the priority for the government for this year is to revive the economy, regardless of the implications for coal use and emissions. However, a successful consumption-led recovery and continued growth in low-carbon energy deployment could still put the country on track to meet its 2025 climate targets and to peak emissions well ahead of the 2030 deadline.
Methodology
The CO2 emissions growth implied by China’s official statistics onenergy consumptionand水泥产量were calculated using IPCC defaultemissions factorsfor coal, oil and gas, andannual data直到2020年排放每吨水泥。
Official energy consumption numbers for 2022 were taken from初步的数据released by the National Bureau of Statistics. The “alternative” estimates of CO2 emissions were based onEmber dataon coal-fired power generation, as well asofficial monthly dataon the output of coke, production of different metals, chemicals, building materials and other industrial products.
For each category, a linear regression model was fitted to past monthly coal consumption data until the end of 2021, and the model was used to predict coal consumption in 2022 based on official output data.
The monthly coal consumption data by sector is based on industry sources and taken fromWind Financial Terminal. This data aligns closely with the official data for the annual total, but provides a breakdown by month and sector.


-
Analysis: Contradictory coal data clouds China’s CO2 emissions ‘rebound’ in 2022