Analysis: China’s CO2 emissions see longest sustained drop in a decade
Lauri Myllyvirta
05.30.22Lauri Myllyvirta
30.05.2022 | 8:00amChina’s carbon dioxide (CO2) emissions fell by an estimated 1.4% in the first three months of 2022, making it the third quarter in a row of falling emissions.
The new analysis for Carbon Brief, based on official figures and commercial data, shows that the three consecutive quarters, when seen together, represent the longest emissions decline in China for at least a decade.
Emissionspeakedin summer 2021, as the governmenttightenedpolicies on real estate to mitigate speculation and financial risk, before starting to fall in thethird quarterlast year. The fall in late 2021 and early 2022 was driven by the continued real estate slowdown and strong increases in clean energy. Starting from late March – at the very end of the period covered by this analysis – the main driver has become harsh Covid-19 control policies.
Furthermore, the second quarter of 2022 appears highly likely to extend the trend of falling emissions – even as the construction sector slowdown bottoms out – due to the impact of Covid lockdowns becoming much more pronounced.
In April, thermal power generation fell by themostsince December 2015, the fall in cement output accelerated and apparent consumption of refined oil fell by almost as much as during thefirst Covid-19 lockdownsin 2020.
This analysis is the latest in a series ofquarterly Carbon Brief updates, with theprevious onehaving reported on the quarterly fall in China’s emissions in the third quarter of 2021.
Longest fall
China has previously seen only two periods of stable or falling CO2 emissions in the past decade. First, during the construction and industrial slowdown of 2013-16, emissions growth halted for three years, with quarterly growth rates alternating between positive and negative.
Then, in the first quarter of 2020, the initial nationwide Covid-19 lockdowns resulted in asteep– butshort-lived– drop in emissions.
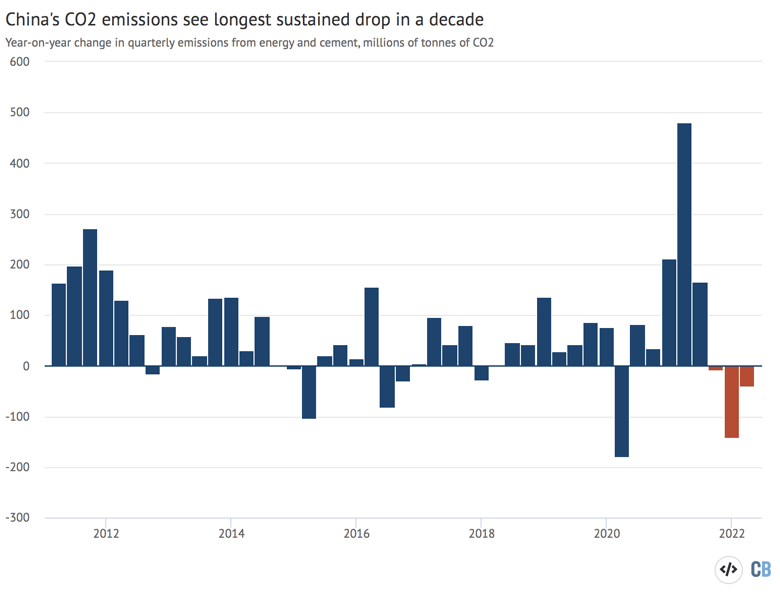
After the lockdown ended in April 2020, the government responded to the negative economic shock with policies designed to boost construction, exports and industrial output, resulting in a highly energy- and carbon-intensive recovery seen in the chart below.
Emissions firstexceededtheir pre-Covid-19 level in the second quarter of 2020, but growth soon cooled. The string of three consecutive quarters of falling emissions – starting in the third quarter of 2021 – is the longest in at least a decade.
The construction slowdown that explains much of the decline in the last few quarters was showing signs of bottoming out in the period to March, with the fall in steel outputmoderatingto 5% year-on-year. This was also expected given the government’semphasison speeding up infrastructure and construction projects.
然而,2022年第二季度仍在应用ears highly likely to extend the trend of falling emissions. In April, the economic fallout from the new round of Covid-19 lockdowns became much more pronounced, becoming the main driver of falling emissions.
Drivers of falling emissions
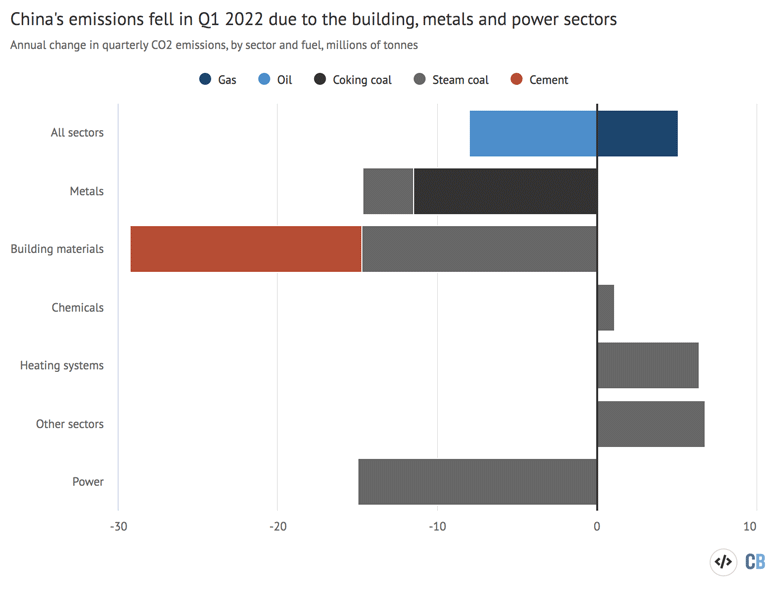
The largest contributor to the fall in CO2 emissions in the first quarter of this year was the cement industry, where output fell 12%, followed by the power and steel industries.
Another contributing factor was the drop in oil consumption, where the effect of Covid-19 control measures was already apparent.
These contributions can be seen in the chart, below, which shows year-on-year changes in quarterly CO2 emissions in China, broken down by sector for coal and cement (lower bars), and by fuel for oil and gas (top bar).
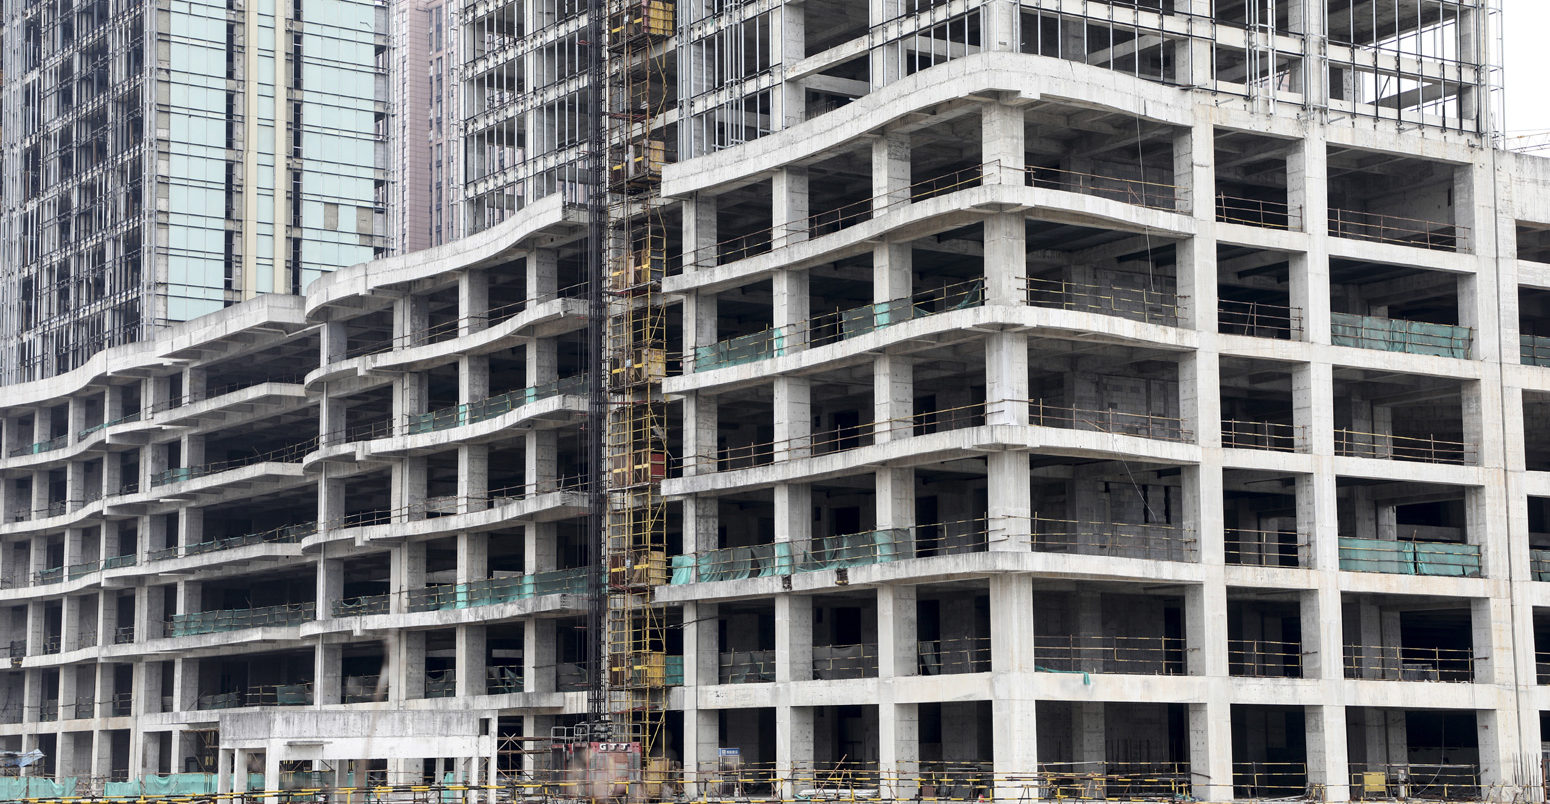
Steel and cement are China’s second and third largest emitting sectors, and the demand for both sectors is largely driven by construction activity, which has been contracting since summer 2021 due to the tighter policies on real estate lending and debt.
虽然在这两个行业产值下降,分析了yabo亚博体育app下载icial data for April started to show diverging trends. Steel output fell by 5% year-on-year in April, much less than in previous months, indicating that output is bottoming out.Pig ironoutput was at the same level as a year ago, the first non-negative reading in almost a year.
To counteract thereal estate slowdownand make it possible to reach GDP targets, the government has beenpromotinginfrastructure investment, which requires a lot of cement, and also quite a lot of steel.
Yet cement output fell a massive 19% year-on-year in April, even more than in previous months. One possible explanation is that in new construction projects, steel is required before cement, to build the reinforcement. Both sectors were affected by falling investment in real estate construction, which saw a 3% reduction year-on-year. Additionally, the steel demand recovery was partially supported by the manufacturing industry.
在电力行业,热发电增加eased 1% year-on-year in the first quarter, but improved power plant thermal efficiency and fuel switching still resulted in a drop in coal consumption.
Theeconomic statisticsfor April report a steep drop in thermal power generation: output from thermal power plants fell 12% year-on-year. This is the largest reduction since December 2015, eclipsing the drop seen during the 2020 Covid-19 lockdown even though electricity demand fell more at that time.
The sharp reduction in thermal power output this April was due to a combination of weak demand – down 4% year-on-year – combined with strong growth of clean energy.
Half of the reduction was due to lower electricity demand, one quarter was due to strong growth in wind and solar output, and one quarter due to good hydropower operating conditions. Power generation from wind and solar increased 15% and 25% year-on-year respectively, while hydropower output jumped 17%.
Wind, solar and nuclear combined will almost certainly overtake hydropower for total generation this year, which is remarkable given the size of China’s hydropower industry.
This development is also positive for the growth of China’s clean energy output overall, as these technologies have very large growth potential, whereas the potential for hydropower expansion has largely been exhausted, as seen in the limited increaseprojectedin long-term energy scenarios for China.
Major push for more coal mines, power plants and blast furnaces
Even as China’s coal demand is falling, the output from domestic coal mines is increasing rapidly. This resulted in a major overall drop in coal imports in the first quarter of the year, asreportedby China Customs, and allowed coal plants and other operators to fill up stockpiles that were depleted during last year’scoal shortage.
Investment in new coal- and gas-fired power capacity is also continuing at a high level. In thefirst four monthsof the year, at least 18 thermal power projects started construction, with a total capacity of 12.8 gigawatts (GW). Another 19 projects with a total capacity of 13.0GW were approved for construction.
Investment innew steel capacityalso stayed at a high level. From January to May 2022, 28m tonnes of new coal-based (blast furnace) iron-making capacity was approved, according to CREA’s compilation of new announcements.
These projects will replace older blast furnaces with brand-new capacity, with a long expected life. This makes the sector ill-equipped to adjust to a reduction in demand for pig iron, as steel demand growth slows down and more steel is produced from scrap instead of pig iron. The amount of new capacity approved corresponds to rebuilding 5% of the existing blast furnace capacity every year.
In steelmaking, our mapping shows new investments have shifted towards electric steelmaking. For the first time, approved new electric arc furnace capacity overtook basic oxygen furnace capacity.
The government isaimingto boost infrastructure and other construction, again, this year to hit GDP targets, or at least shrink the shortfall. This could result in an increase in coal demand towards the second half of the year, but the data to date suggests little sign of this so far.
One reason forthe pushfor more coal output and coal power plants is that the2021 coal shortage, and the resulting power rationing, were clearly something China’s central plannerswant to avoidat any cost.
This has prompted the “all-of-the-above” expansion of coal mining, coal-fired power andclean energy, to ensure similar shortages are avoided. The energy security drive has meant that measures to avoid overcapacity, such as the coal power traffic lights system and coal power capacity control targets have not been published, and theclosureof older coal power plants has been put on hold. The planners appear prepared to accept the risk of building too much capacity, even if it ends up under-utilised and risks financial losses.
Avoiding any electricity shortages is all the more important because of the political importance of this year – the twice-a-decade Communist Party Congress that selects the party’s new leaders is scheduled for later in 2022.
Furthermore, the Chinese government iscurrently pushingfor all kinds of infrastructure and construction projects to offset the effect of the real estate slump and Covid lockdowns on other parts of the economy. Coal mines, power plants and blast furnaces are just some of the recipients of this government backing.
The support for construction projects is also benefiting low-carbon technologies. Solar PV installationsincreased140% year-on-year in the first four months of 2022 and wind installations by 45%. As approximately 103GW of wind and solar was installed last year, the early part of 2022 puts it on track for another world record in terms of annual growth.
Electric vehicle (EV) manufacturing continues to skyrocket. Output more than doubled, again, in January-April compared with one year ago, while overall auto production fell. EVs made up a record 21% of all vehicles produced.
Will emissions rebound?
The sharply fluctuating energy trends and economic policies make it difficult to predict energy demand growth in China in the months and years ahead.
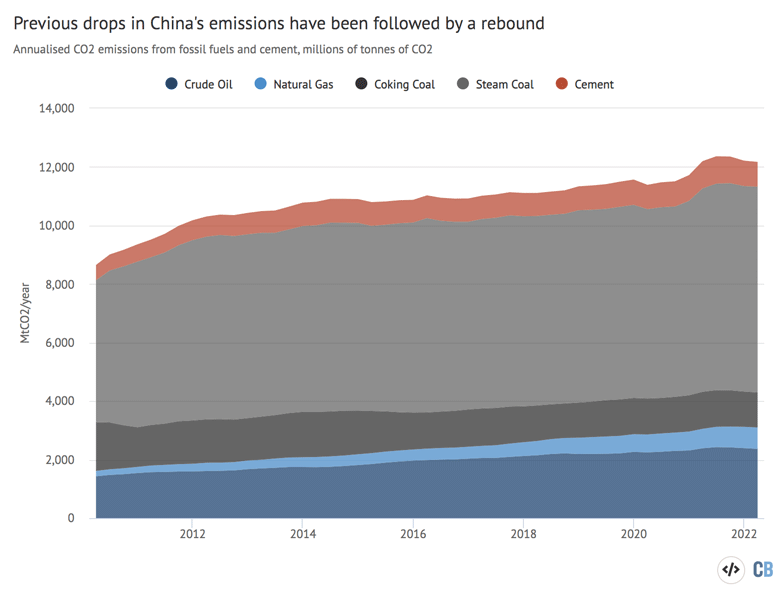
The previous episodes of falling emissions in China have been followed by rebounds. After the 2007 financial crisis, the government launched anunprecedented stimulus programme,leadingto even faster emissions growth than before the crisis.
The 2013–16 slowdown was followed by a more gradual rebound – and after theCovid-19 lockdown, emissionssurgedfar above pre-Covid levels, as seen in the chart below.
Stimulating construction, rather than incomes and consumption, is along-running featureof China’s response to negative economic shocks. This results in periods of carbon-intensive growth, as producing steel and cement for construction is far more emissions-intensive than producing consumer goods and services.
Since late 2021, the government hassought to increaseand speed up infrastructure and other construction projects, following the same pattern.
Whether the current fall in emissions results in another rebound depends mainly on three factors: how large is the infrastructure construction programme this time; will the real estate sector inflate again; and how fast does clean energy investment grow.
An indiscriminate wave of stimulus projects would go against the government’s aims of achieving “high-quality growth“, as well as onavoidingdebt and financial risks.
There is also a practical question of how large an investment programme local governments are willing and able to underwrite, given theiralready high debt levelsand thesignificant damageto their finances from the contraction in real estate and land sales.
Real estate has continued to contract. In April,government figuresshow the floor space of newly started buildings fell to the lowest level since 2015.
The central bank and many local governments havetaken stepsthis year to support real estate, including by easing mortgage conditions. In 2020, the money people did not consumefound its wayto real estate, resulting in a major increase in steel demand and emissions in late 2020 and early 2021.
In 2022, the drop-off in real estate sales has beeneven deeper比地g the initial lockdowns in 2020, as lack of confidence and uncertainty over economic outlook have dampened appetite.
Even if energy demand growth rebounds to a moderate level due to the stimulus programme or a general economic recovery, the effect on emissions could be offset by rapid expansion of clean energy.
Central and local governments have setvery ambitious targetsfor wind and solar power installations during the five-year period from 2021 to 2025. If fully realised, the planned clean energy expansioncould coverall additional energy demand growth over the period, enabling coal consumption and emissions to peak before 2025.
Data sources
Data for the analysis was compiled from the National Bureau of Statistics of China, National Energy Administration of China, China Electricity Council and China Customs official data releases, and from WIND Information, an industry data provider.
When data was available from multiple sources, different sources were cross-referenced and official sources used when possible, adjusting data from WIND Information to match.
CO2 emissions estimates are based on National Bureau of Statistics default calorific values of fuels and IPCC default emissions factors. Cement CO2 emissions factor is based on2018 data.
For oil consumption, apparent consumption is calculated from refinery throughput, with net exports of oil products subtracted.
When official releases did not provide changes from 2021 to 2022, these are calculated from the linked release and previous iterations of the same regular release, although only the latest one is linked to.