Analysis: China’s CO2 emissions in Q2 2023 rebound to 2021’s record levels
Multiple Authors
08.10.23Multiple Authors
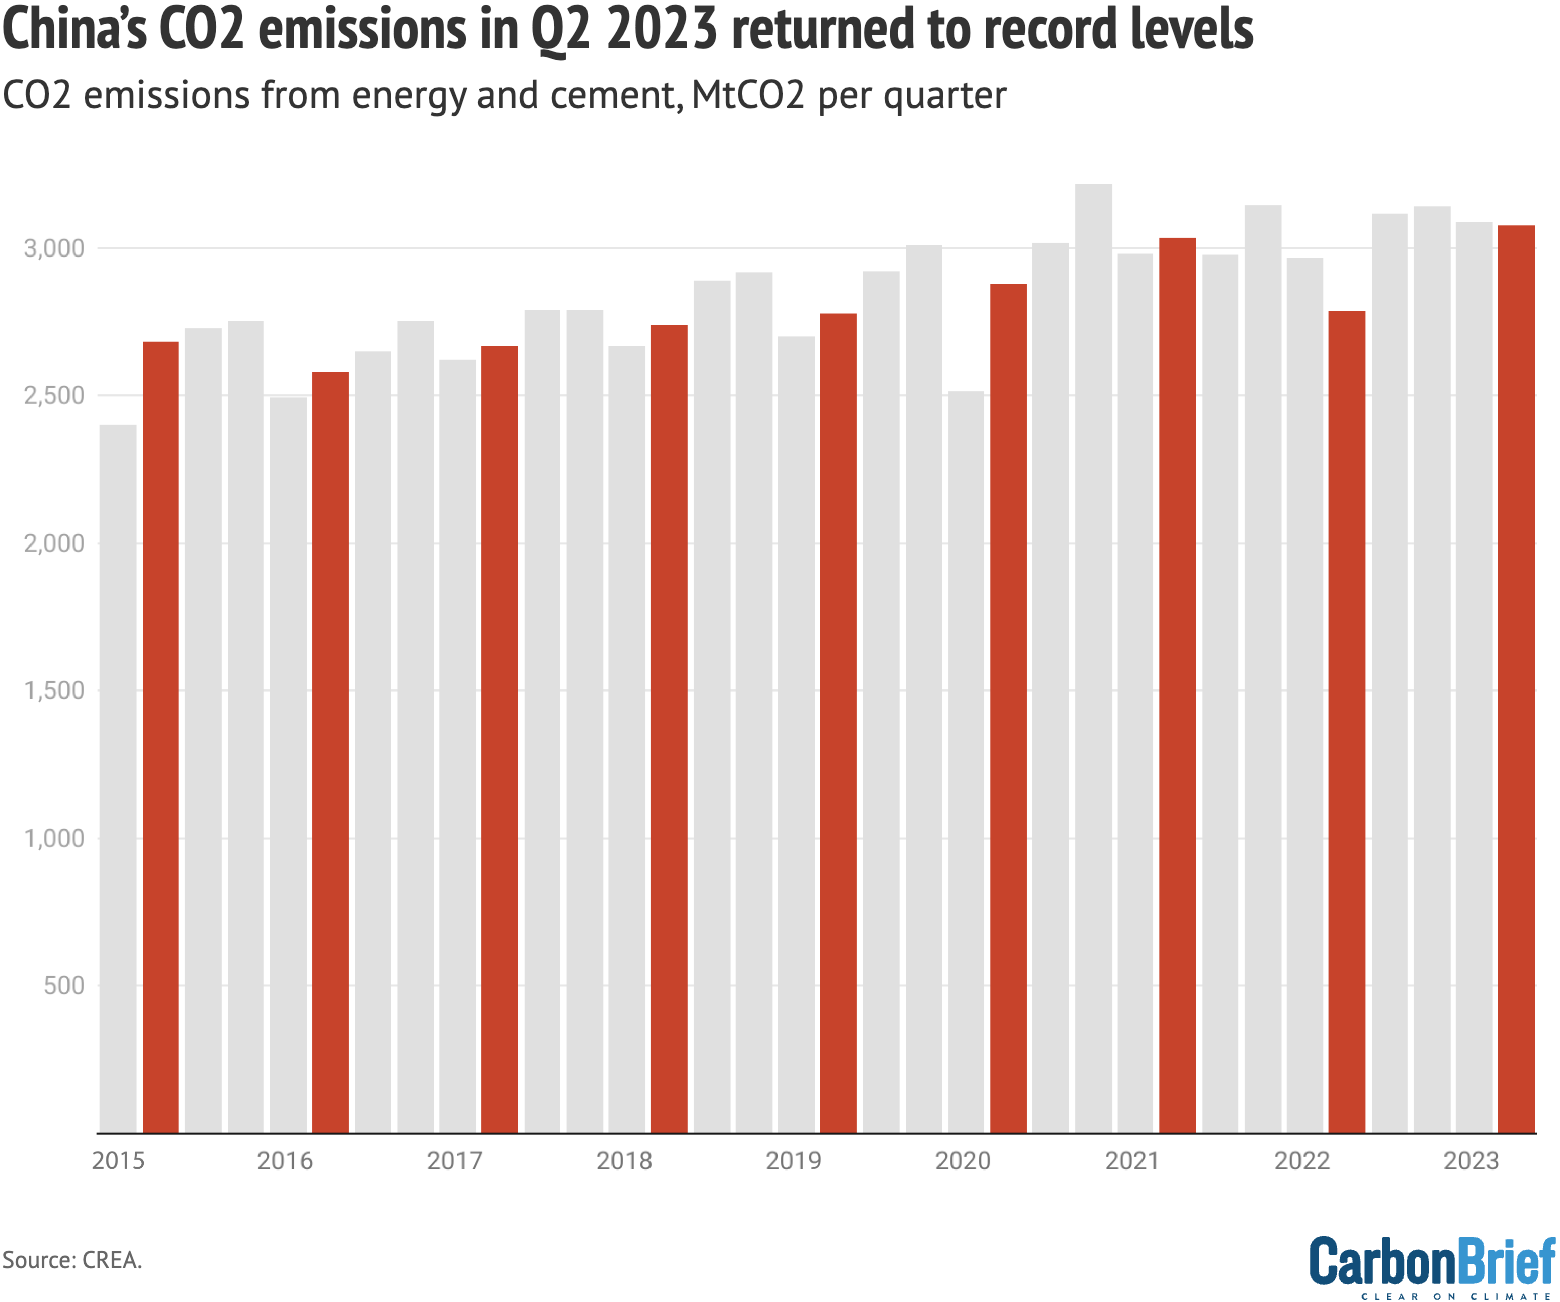
10.08.2023 | 6:00amChina’s carbon dioxide (CO2) emissions grew 10% year-on-year in the second quarter of 2023, rising approximately 1% above the record levels seen in 2021.
The new analysis for Carbon Brief, based on official figures and commercial data, shows the increase was driven by two factors.
First, the comparison is being made with the second quarter of 2022, when emissions were still suppressed due to the Covid lockdowns which had shut down Shanghai and much of the country.
Second, the ongoing drought has seen a plunge in the output of China’s large hydropower fleet.
Without these one-off factors, China’s emissions would likely now have stabilised.
Looking ahead, China’s economic recovery after the lifting of Covid controls has been sluggish, raising expectations of a new round of carbon-intensive stimulus measures.
China is also continuing a surge in coal power construction that started last summer, with investments in coal-based steel capacity continuing at a high rate. Much of this will be completed in the “15th five-year plan” period (2026-2030), when China has pledged to reduce the consumption of coal.
On the other hand, investment in low-carbon energy continues to grow at a staggering pace. If low-carbon capacity growth meets forecasts, it would be sufficient to cover expected electricity demand growth and could even put China on track to peak its emissions within two years.
Overall, the latest quarterly analysis shows:
- Emissions rebounded forcefully from the Covid lockdown lows of 2022, rising slightly above the record levels of 2021.
- The rebound in emissions was driven by major increases in coal-fired power and transportation.
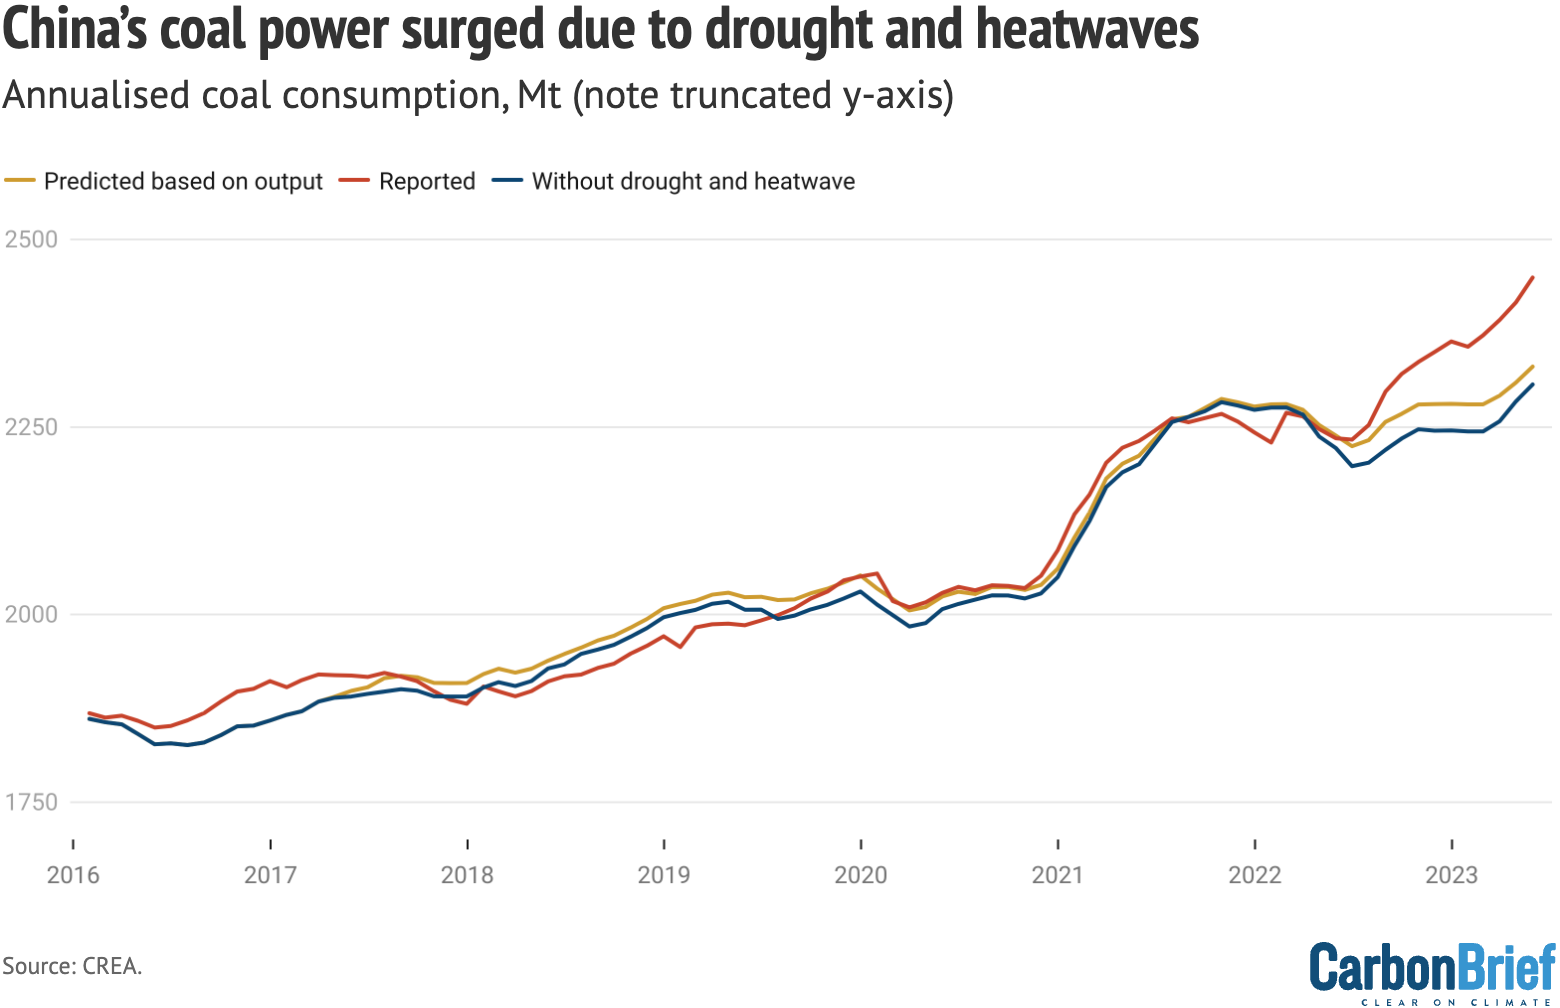
- The increase in coal-fired power is due to weather-related factors. Without this weather variation, coal-fired power generation would remain below its peak.
- Low-carbon energy additions have reached the level where they can now cover all of the expected growth in electricity demand, if maintained.
- China’s sluggish economic recovery from the “zero-Covid” period has built up expectations of government stimulus for carbon-intensive sectors.
- The rapidly rising use of electric vehicles is, for the first time, substantially curbing petrol demand growth.
- The push for new coal power and steel plants continues.
Emissions top 2021’s record levels – just
China’s CO2 emissions increased an estimated 10% year-on-year in the second quarter of 2023, rebounding approximately 1% above the record levels of 2021.
The increase is due to two factors: the comparison to the steep drop in the second quarter of 2022 caused by Covid-19 lockdowns in Shanghai and across the country; and theongoing plungein hydropower generation caused by droughts.
Helping to mitigate the emission increase, low-carbon energy investment continues togrow以惊人的速度增长。预测的能力added this year would be sufficient to cover all of the expected electricity demand growth, putting an emission peak in sight. Without the short-term variation in hydropower output and rebound in oil consumption after the “zero-Covid” period, emissions would have stabilised already.
也就是说,排放量的增加是由于one-off rather than structural factors.
Oil consumption has rebounded, but less thanexpected, after the lifting of the Covid-19 controls. In other respects, the economic recoveryhas been sluggish, raisingexpectations由政府碳密集型的刺激。
The coal power plant building spree that started in the summer of 2022 has continued, with two coal power plants per week permitted and starting construction in the first half of the year.
Investments in coal-based steel capacity also continue at a high rate. This means that a lot of coal power and coal-based steel capacity will be completed after 2025, at the time when China has committed to start reducing its coal consumption.
Coal power and transportation drove rebound
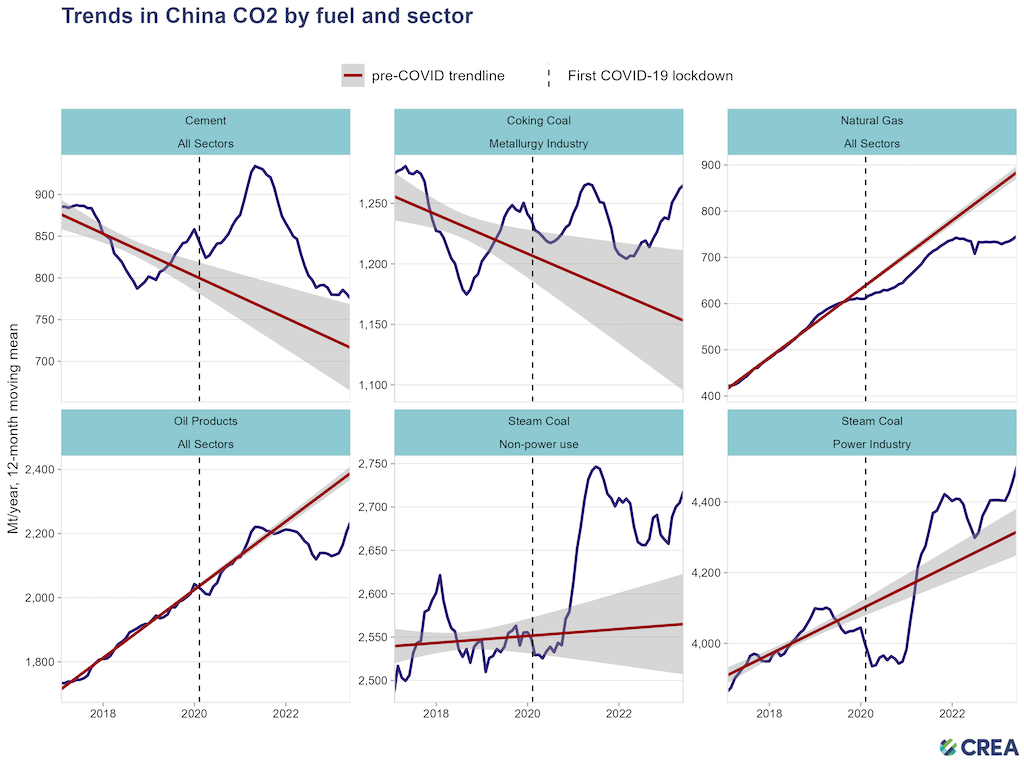
Coal-fired power generation increased 15% and oil consumption 18% in the second quarter, making these two sectors the largest sources of increase in emissions.
Steelproduction growth ground to a halt in June, after a short-lived jump early in the year, andcementproduction began to fall, weighed down by falling volumes in real-estate construction.
These two sectors are the largest CO2 emitters in China after the power sector and the coal consumption relating to steel and cement production is far above the pre-pandemic trend due to pandemic-era economic policies favouring construction and heavy industry.
The consumption of fossil gas has plateaued since late 2021 when global gas prices shot up as a result of Russia cutting back supply to Europe and after the country’s invasion of Ukraine intensified energy security concerns. This has been accompanied by policies discouraging a further shift from coal to gas, as well as investments in new coal plants inprovincesthat have used gas for heating and power generation.
Transport emissions
Oil consumption growth was driven by diesel, indicating that the rebound comes mainly from freight and public transport, rather than private cars. Petrol consumption, an indicator of private car and light vehicle transport, has begun to rebound, but remains below the pre-pandemic trend.
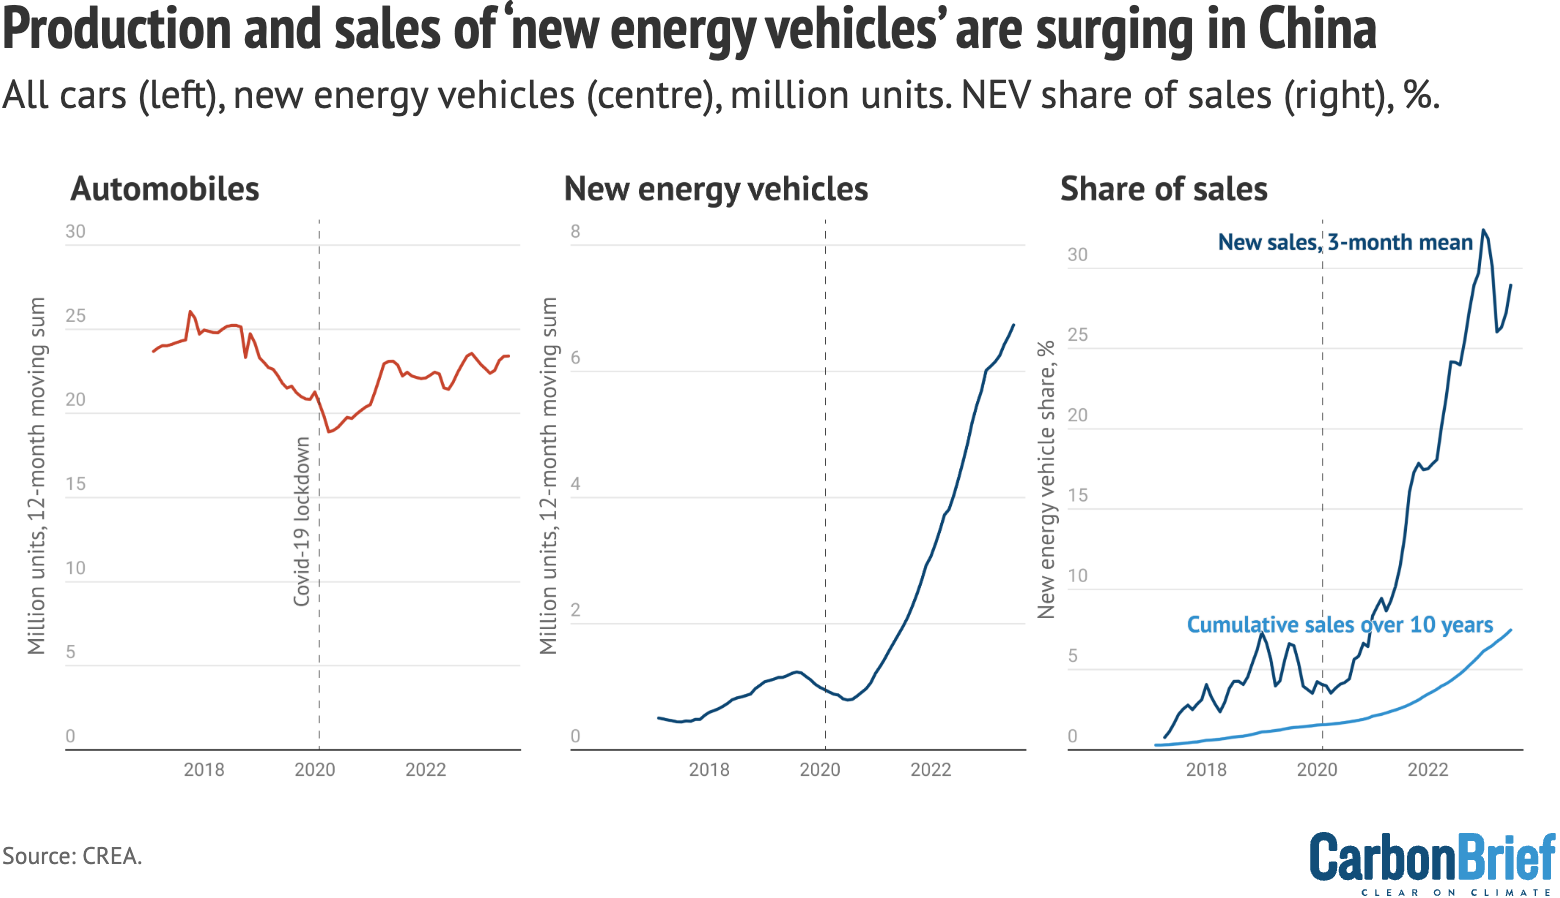
The rapid adoption of electric vehicles (EVs) is starting to have a material impact on petrol demand.
EVs, including plug-in hybrids, made up 28% of all vehicles sold in the first half of 2023, up from 22% in 2022 and 4% in 2020. As a result, the share of EVs out of all vehicles sold in the past decade – a proxy for the mix of cars on the road – increased from 4.5% a year ago to 7.5% at the end of June 2023. This means that EV adoption likely shaved approximately three percentage points off petrol demand growth. This illustrates why Sinopec, China’s oil-and-gas giant, recentlysaidthat the transition to EVs would cause China’s petrol demand to peak in 2023.
EV adoption is already helping to reduce CO2 in China, on average, with estimated life cycle emissions per kilometre drivenaround 40%lower than for gasoline-fueled cars; the differential will widen as power generation is decarbonised.
Impact of extreme weather
The increase in coal power generation was not due to strong demand growth: electricity consumption only increased 5%. The reason was that hydropower generation collapsed as a result of the drought in the third quarter of 2022 and the ongoing low rainfall since then.
In contrast, hydropower output was at record levels in the second quarter of 2022, skewing year-on-year comparisons.
Rainfall has been weak in the first half of 2023 and, in addition, hydropower operators have beensaving waterin their reservoirs to prepare for the summer peak demand season.
This is a shift from 2022 when hydropower plants were generating at a high rate in the second quarter, oblivious to the risk of power shortages. Due to China’s fixed electricity tariffs, there is no incentive for hydropower operators to time their output to match periods of high demand. This year, with ensuring power supply high on the political agenda, the drive to save water indicates that administrative orders have replaced economic incentives.
The summers of 2022 and 2023 have been much hotter than previous ones, based on CREA’s analysis of population-weighted average cooling degree days from the US National Centers for Environmental Prediction (NCEP) gridded dailyweather data, and the prevalence of air conditioning hasincreased, leading to increases in power demand for cooling.
The increase in power generation from thermal power plants (ones that burn fossil fuels or biomass) is the automatic short-term response of any power system to a drop in non-fossil power generation. This is because non-fossil power plants have lower operating costs than fuel-burning plants and are, therefore, generating at maximum possible output essentially all the time.
As a result, there is no headroom to increase power generation from non-fossil sources without adding new capacity, which takes time. The increase in coal-burning to cover the drop in hydropower should, therefore, not be confused with an intentional or systemic shift in the power mix, as much media reporting hastended to do.
The jump in coal demand for power generation has resulted in a sharpincreasein coal imports, which doubled year-on-year. This happened despite intense governmenteffortsto boost domestic coal production. The surge in imports makes it even clearer that the domestic mining boom hasrun into limits. The failure to meet the increase in coal demand from domestic sources also undermines the idea that reliance on coal translates into energy security.
Low-carbon energy surging
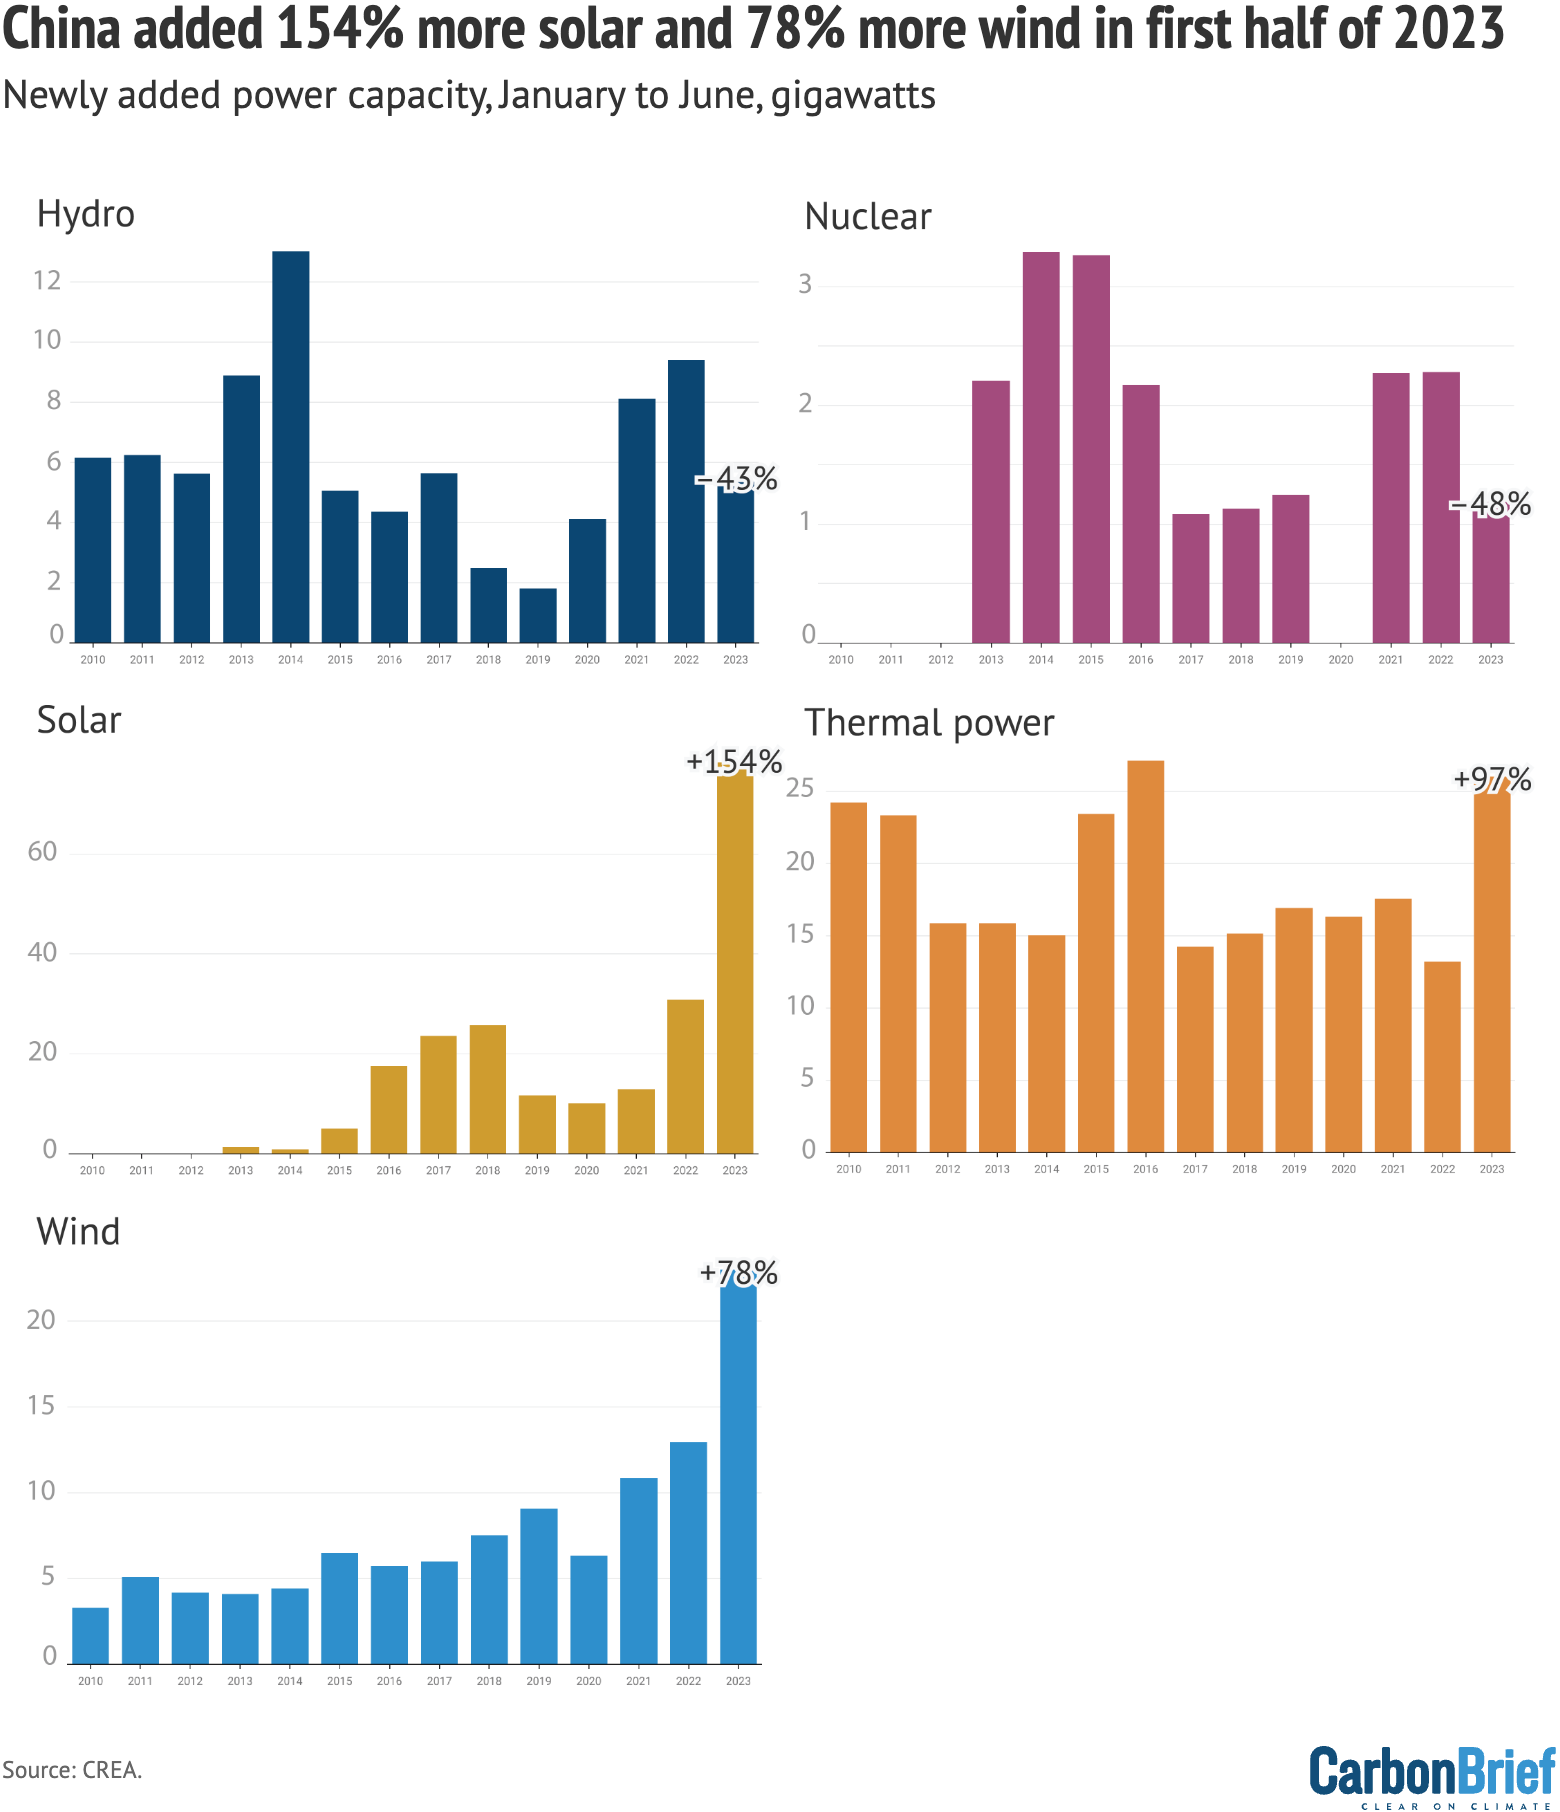
Some 78 gigawatts (GW) of solar and 23GW of wind, along with 1.2GW of nuclear and 5GW of hydropower, were added to China’s grid in the first half of 2023.
Solar and wind installations increased by 150% and 80%, respectively. To put this in perspective, the solar power installations completed in just six months are equal to the total installed solar power capacity of Germany.
Some of the surge in solar power installations isdueto a glut of projects that had been held up by Covid-19 controls, but installations will need to stay at these levels – at least until the end of 2025 – iftargetsset by local governments are to be met.
This rate of low-carbon energy additions is sufficient to cover electricity demand growth up to 4% per year: the projected annual increase in generation based on current average utilisation of different technologies is 380TWh, almost 1.5 times the total consumption of the UK. In the first half of 2023, China’s power demand grew at 5%.
但仍r, there are possible signals that the low-carbon energy growth is being framed as “excessive”, with regulators contemplating new interventions.
National Energy Administration official Xing Yitengexpressedconcern that the increase in installations is highlighting the “challenges” of grid integration due to the insufficient capacity ofdistribution networks. He said that the rapid growth has raised the risk of “significant ups and downs” for the industry, implying that there is a risk of a downturn after the current phase of explosive growth. Xing also pointed out that the race to install capacity has seen instances of “encroachment” on farmers’ and households’ interests.
On the other hand, China’s leader Xi Jinping recentlycalled, again, for stronger measures to implement China’s climate commitments, which would not be consistent with a significant slowdown in low-carbon energy investments.
Expectations building for construction stimulus
After lifting Covid-19 restrictions in late 2022, the governmentsaidit would pursue a consumption-led economic recovery. This recovery does not seem to be materialising, with retail sales onlyincreasing3% year-on-year in June. The government has not introduced policies that would boost household spending power substantially, at least in the short term.
Other parts of the economy are not coming to the rescue either – exports are facingheadwindsand the adjustment of the real-estate sectorcontinues, with floor space of newly started construction projects falling by no less than 24% in the first half of 2023. As a result of weak demand from these sectors, manufacturing growth has also been sluggish.
The weak economic performance hasraised expectationsof government stimulus o inflate the real-estate market and boost construction – a recurringpatternwhen economic growth in China falls short of expectations. Infrastructure construction has already started to pick up since early 2023, asindicatedby the sector’s electricity consumption.
但仍r, falling real-estate construction volumes have more than offset the effect of the government’s increased infrastructure spending on the demand for construction materials.
The stimulus efforts will continue to be limited by the financial situation of local governments which, according to the International Monetary Fund, are burdened bydebtsexceeding 66 trillion yuan (equivalent to half of the country’s annual GDP) andaffectedby the real-estate downturn. Local governmentsrelyon land sales for much of their revenue and the value of land salesfell48% in 2022, after which the National Bureau of Statistics has stopped publishing monthly data.
Rush for new coal power and steel plants continues
After a surge in the second half of 2022, the rapid pace of coal power plant permitting has continued in 2023, with Greenpeace researchfindingthat 50GW of new projects were approved in the first half of the year.
Concernsabout a shortage of non-weather-dependent capacity to cover electricity peak loads in the summertriggeredthe wave of new coal power projects in summer 2022, but, currently, new projects are being started across the country in areas where there is no need for additional generating capacity (based on acomparisonof reported peak loads and available dispatchable capacity).
The steel industry, the second-largest emitter in China after the power sector, has also continued to invest innewcoal-based capacity. In the first half of 2023, the industry announced blast furnace projects with the capacity to produce 26m tonnes per annum (Mtpa) of blast furnaces and 15Mtpa of basic oxygen furnaces, which is almost equal to more than Germany’s total ironmaking capacity and nearly one third of Germany’s steelmaking capacity. Around40%of China’s production capacity will be replaced with brand-new plants by 2025.
The coal power building spree is strongly supported by the central government. The National Energy Administration hasput pressureon provinces to start the construction and operation of “supportive power sources” (as coal power is now being referred to) as fast as possible. A NEA officialpraised新煤电厂在7月的新闻发布会上为职业viding strong support for guaranteeing electricity supply.
Many of these projects will only be completed during the 15th five-year plan period, covering 2026-2030, when China hascommittedto reducing its coal consumption. Unless already permitted projects are cancelled, or retirement of existing capacity is dramatically accelerated, the new projects will translate into an increase in capacity at a time when coal use is supposed to be falling.
One way in which the government is trying to square the circle is by reining in new projects and coal consumption in the coal-to-chemicals sector. A new policynotice, issued in July, aims to restrict new coal-to-chemicals projects and discontinue large projects introduced in the previous five-year plan. It also removes coal-to-oil and coal-to-gas from the list of industries that the government and state-owned enterprises are expected to promote, leaving only higher-value chemicals. Finally, the policy notice says coal supply to power and heat must be prioritised over the coal-to-chemicals industry.
The main motivation stated by the policy is to prevent coal-to-chemicals competing with coal power plants for tight coal supply, but it will also help peak emissions while leaving a bit more room for emissions from the power and steel sectors by mitigating emissions from the coal-to-chemicals industry.
The buildup of new coal power and coal-based steel capacity fuels an already powerful carbon-intensive political and economic constituency, including the companies themselves and the local governments that depend upon them for revenue and jobs.
This could increase the risk of pushback against the emissions cuts that would result from the expansion of – and larger market share for – low-carbon energy sources.
Another risk is that carbon-intensive actors could lobby for policies to promote energy-intensive infrastructure, construction and industrial projects that would absorb the extra steel and power capacity they are building and, thus, avoid stranding their newly built assets.
As it stands, to peak its CO2 emissions in the next two years, China’s growth of low-carbon energy needs to be maintained and there should be no major acceleration in energy demand growth.
但仍r, investments and policies have yet to be aligned with this emission peaking timeline, suggesting policymakers are keeping their options open.
Data sources
Data for the analysis was compiled from the National Bureau of Statistics of China, National Energy Administration of China, China Electricity Council and China Customs official data releases, and from WIND Information, an industry data provider.
Power sector coal consumption was projected based on power generation, to avoid theissuewith official coal consumption numbers affecting 2022–23 data. June 2023 data on apparent coal consumption was not available at the time of publication, so coal consumption in different sectors was projected based on the output of relevant industrial products, e.g. coke for the consumption of coking coal; cement and glass for building materials industry. Coal consumption for heating was projected based on population-weighted average heating degree days calculated from NCEP gridded dailyweather data.
When data was available from multiple sources, different sources were cross-referenced and official sources used when possible, adjusting total consumption to match the consumption growth and changes in the energy mixreportedby the National Bureau of Statistics.
CO2 emissions estimates are based on National Bureau of Statistics default calorific values of fuels and IPCC default emissions factors. Cement CO2 emissions factor is based on2018 data.
For oil consumption, apparent consumption is calculated from refinery throughput, with net exports of oil products subtracted.


-
Analysis: China’s CO2 emissions in Q2 2023 rebound to 2021’s record levels