夏季北极海冰最低2022 is ‘joint-10th lowest’ on record
Multiple Authors
09.23.22Arctic sea ice has reached its minimum extent for 2022, tied with 2017 and 2018 as the 10th lowest on record, according toprovisional datafrom the USNational Snow and Ice Data Centre(NSIDC).
The last 16 years have seen the 16 lowest Arctic sea ice minimum extents in the satellite record, it adds.
Tracking near the 2010s decadal average, Arctic sea ice extent over the summer of 2022 has been “uneventful”, one scientist tells Carbon Brief.
The melt season has been characterised by “cloudier weather, favourable winds and stormier conditions across the middle of the Arctic Ocean”, which prevented rapid melting, he adds.
However, at the Earth’s opposite pole, sea ice extent has hit record lows in recent months. According to the NSIDC, Antarctic sea ice extent tracked at “record or near record lows” for most of its growth season, before seeing a “spurt in growth” in September.
Minimum
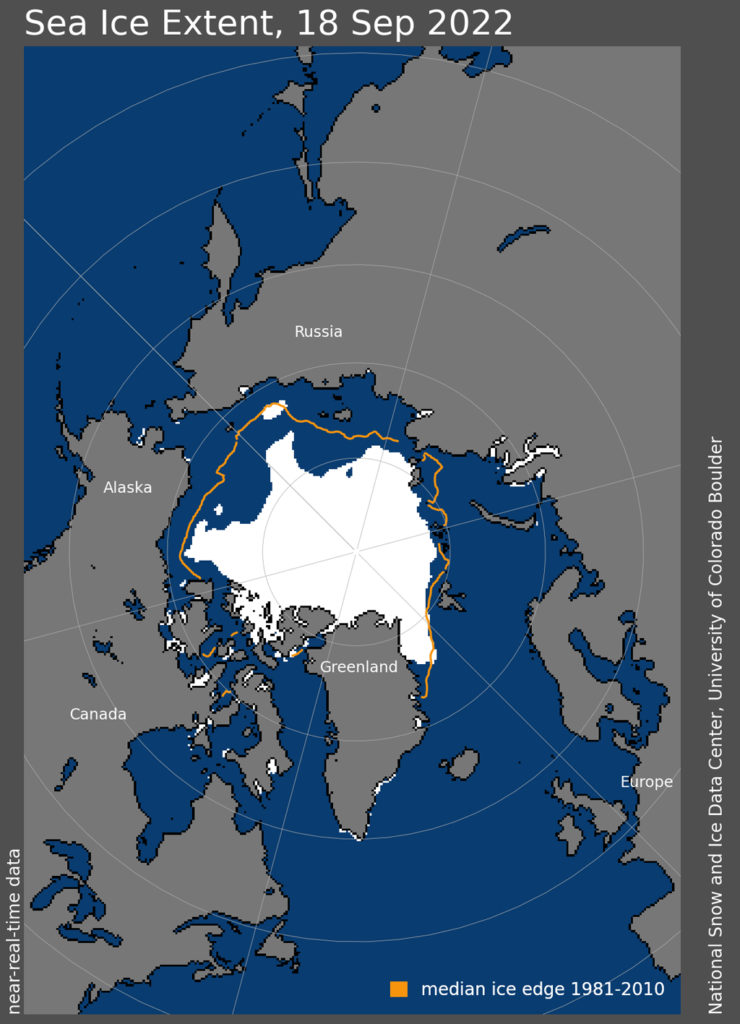
Arctic sea ice extent reached its annual minimum extent of 4.67m square kilometres (km2) on 18 September, according to the NSIDC. This is the 10th lowest minimum in a satellite record stretching back 43 years – joint with 2017 and 2018.
The minimum is 1.55m km2 smaller than the 1981-2010 average minimum extent – equivalent to twice the size of Texas – the NSIDC notes.
The map below shows Arctic sea ice extent on 18 September. The orange line shows the 1981-2010 average extent for that day.
“Compared to some recent extreme years, this summer was relatively uneventful in the Arctic,”Dr Zack Labe– a postdoctoral researcher working atNOAA Geophysical Fluid Dynamics Laboratoryand theAtmospheric and Oceanic Sciences ProgramatPrinceton University– tells Carbon Brief.
He says that while this year’s ranking “may not sound very impressive at first”, it is “important to note just how large changes have been in the Arctic over the last few decades”. For example, Labe highlights decadal trends of decreasing Arcticsea ice thickness. He adds:
“Despite the year-to-year variability and no new records observed this year, the long-term trends are very clear in the Arctic. This can be linked to human-caused climate change.”
Prof Julienne Stroeve– professor of polar observation and modelling atUniversity College Londonand asenior scientistat the NSIDC – also notes the long-term trend of declining sea ice.
She tells Carbon Brief that, “overall, the Arctic was not much warmer than average this summer”, but adds that “ice extent still dropped below 5m km2, which never used to happen until 2007”.
Slow starts and warm spells
The Arctic melt season kicked off from the sea ice maximum – the point when Arctic sea ice covers its largest area at the end of winter. This occurred on 25 February – thethird earliestin the satellite record. At 14.88m km2, the extent was the 10th smallest maximum on record.
TheNSIDCsays the Arctic’s summer melt season began in “fits and starts”. Their scientists highlighted several “extreme warm events” in March, which saw above average air temperatures. For example, on 14 March, air temperatures north-west of Greenland were up to 15C above average, they note, adding that these warm events were “associated with large transports of water vapour into the region”.
Wow – well above average temperatures were observed over nearly the entire#ArcticCircle in March 2022…
-扎克拉贝河(@ZLabe)April 7, 2022
[Data:@CopernicusECMWFERA5 reanalysis]pic.twitter.com/Ie40P5NZaP
However, the month saw a “very slow” rate of sea ice loss overall. By the end of March, sea ice cover was at 14.5m km2, showing little change from the end of February.
The slower-than-average decline in ice cover continued into April. The average Arctic sea ice extent for April 2022 was 14.06m km2 – the 11th lowest in the 44-year satellite record.
TheNSIDCexplains that strong offshore winds throughout the early summer season over the north-west coast of Alaska createdpolynyas– areas of open water surrounded by sea ice. After the first round of strong winds at the end of March, the polynyas “quickly refroze”.
4月12日,进一步强风引起另一个polynya. The refreezing of this polynya was “noticeably slower” – caused by higher surface air temperatures by the end of the month, according to the NSIDC. Temperatures in most areas in the Arctic in April were 2 to 3C above average, it adds.
Labe tells Carbon Brief that the “cloudier weather, favourable winds and stormier conditions across the middle of the Arctic Ocean” helped to “prevent some of the melting and sea ice contraction that might have otherwise contributed to even lower Arctic sea ice levels”.
In May, “only” 1.28m km2 of sea ice extent were lost, theNSIDCsays, with ice cover “above levels not seen since 2013”. Scientists at the NSIDC attributed the extensive ice cover to lower than average temperatures in Baffin Bay, in Canada.
Fluctuating air temperatures across the Arctic region continued into June. In Canada’s Hudson Bay, temperatures were 4 to 5C above average – driving “unusually early” sea ice loss and“near-record low” sea ice extent in the region. Meanwhile, temperatures over northern Greenland, the northern Yukon and North Slope, and easternmost Siberia were 2 to 4C below average.
Overall, June saw average Arctic sea ice extent rank 10th lowest on record at 10.86m km2.
Average June 2022#Arcticsea ice extent was the 10th lowest on record
-扎克拉贝河(@ZLabe)July 2, 2022
This was 900,000 km² below the 1981-2010 average. June ice extent is decreasing at 3.89% per decade (satellite-era). Data:@NSIDC.pic.twitter.com/9NRtQAxtBG
Although this melt season was not record-breaking, Labe tells Carbon Brief that there were still “notable anomalies” in the Arctic this summer.
For example, he notes that the Barents Sea region was “effectively ice-free” by early July. This was driven by “unusually early decline in Barents sea ice [leading] to more incoming solar radiation being absorbed into the open water”, he says. This “led to more ocean warming and subsequently sea surface temperatures were at least a 4C above average”.
The average rate of Arctic sea ice decline from July into August continued at a “near average pace”, theNSIDCsays. While sea ice extent recorded on 1 August was “well below” the 1981 to 2010 average, it was the highest level since 2014, at 6.99m km2.
NSIDC scientists called the amount of open water along the Eurasian coast in the Laptev Sea “notable”, but added that the pattern is “much less extreme than observed in 2020 and 2021”.
During the first half of August, air temperatures were “modestly above average from the Beaufort Sea across the pole and towards the Kara and Barents Seas”, while they were “slightly below average” over parts of the East Siberian, Laptev and Bering seas, according to theNSIDC.
As September drew on and the sun began to set on the Arctic melt season, sea ice extent was tracking close to the levels observed in 2010, theNSIDCsays. It adds that by mid-September, the high-latitude polynas had frozen over.
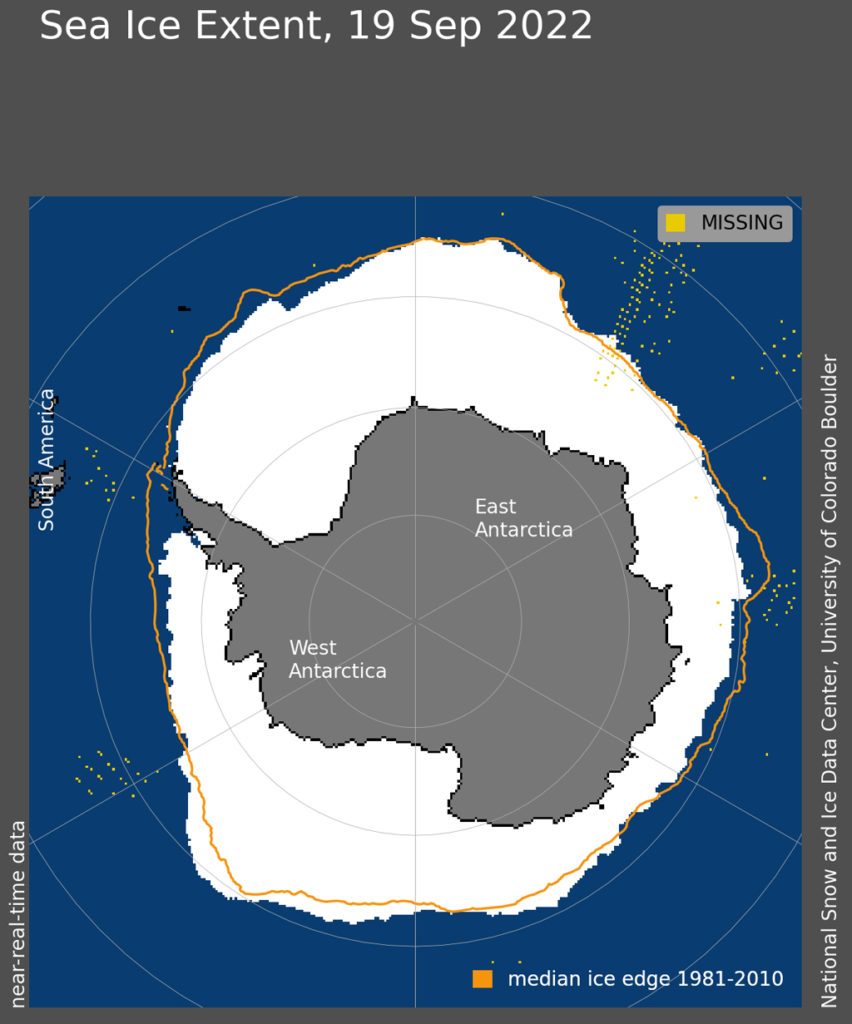
Record lows in Antarctica
At the Earth’s southern pole, sea ice extent has tracked at record or near-record lows for much of the year.
In February, the Antarctic recorded arecord low minimumsea ice cover, falling below 2m km2 for the first time in the satellite record.
In March, the continent experienced “unusual warmth” – with one high-elevation station in Russia recording temperatures more than 35C above average for the time of year. During this month, the Conger ice shelf in East Antarctica broke up into several large pieces. However, scientists at theNSIDCsay that the event was not “directly related to the recent record low sea ice extent or the recent heatwave”.
Low sea ice extent levels persisted throughout the Antarctic winter. In May, strong winds in the Bellingshausen and Amundsen seas brought warm conditions to the sea ice edge and led to a “slowdown” in ice growth rate.
A newrecord-low ice extentwas set on 20 June, and air temperatures were above average across the continent throughout the month. In mid-July, Antarctic sea ice extent was14.8m km2below the previous record daily low set in 2017.
The year of extremes continues in the#Antarcticwith sea ice extent well below the previous record low for the current date.pic.twitter.com/GFDNBa1Dod
-扎克拉贝河(@ZLabe)July 27, 2022
Antarctic sea ice extent remained “at record or near-record low extent” for August, according to theNSIDC. However, as the Arctic minimum drew near, the Antarctic saw a “spurt of growth”, it says.
On 20 September, the NSIDC announced that “extent has reached the 10th percentile [bottom 10%] for this time of year, still well below average but no longer near the record lowest maximum”.
下面的地图显示了tarctic sea ice extent on 19 September. The orange line shows the 1981-2010 average extent for that day.