Analysis: ‘Global’ warming varies greatly depending where you live
Zeke Hausfather
07.02.18Zeke Hausfather
02.07.2018 | 4:48pm的一部分Paris Agreementon climate change, the international community committed in 2015 to limit rising global temperatures to “well below” 2C by the end of the 21st century and to “pursue efforts to limit the temperature increase even further to 1.5C”.
However, these global temperature targets mask a lot of regional variation that occurs as the Earth warms. For example, land warms faster than oceans, high-latitude areas faster than the tropics, and inland areas faster than coastal regions.
Furthermore, global human population is concentrated in specific regions of the planet.
Here, Carbon Brief analyses how much warming people will actually experience where they live, both today and under future warming scenarios.
The warming experienced by people is typically higher than the global average warming. In a world where warming is limited to “well below” 2C about 14% of the population will still experience warming exceeding 2C. In the worst-case scenario of continued growth in emissions, about 44% of the population experiences warming over 5C – and 7% over 6C – in 2100.
Warming is not globally uniform
Different parts of the world respond in different ways to warmingfrom increasing greenhouse gas concentrations. For example, ocean temperatures increase more slowly than land temperatures because theoceans lose more heatby evaporation and they have a largerheat capacity.
High-latitude regions – far north or south of the equator – warm faster than the global average due to positive feedbacks from the retreat oficeandsnow. Anincreased transfer of heatfrom the tropics to the poles in a warmer world also enhances warming. This phenomenon of more rapidly warming high latitudes is known aspolar amplification.
Both of these effects can be seen over the past century. The figure below shows warming measured between the start of the 20th century (1900 to 1920) and present (1998 to 2018). Grey areas represent regions where insufficient temperature records were available early in the 20th century.
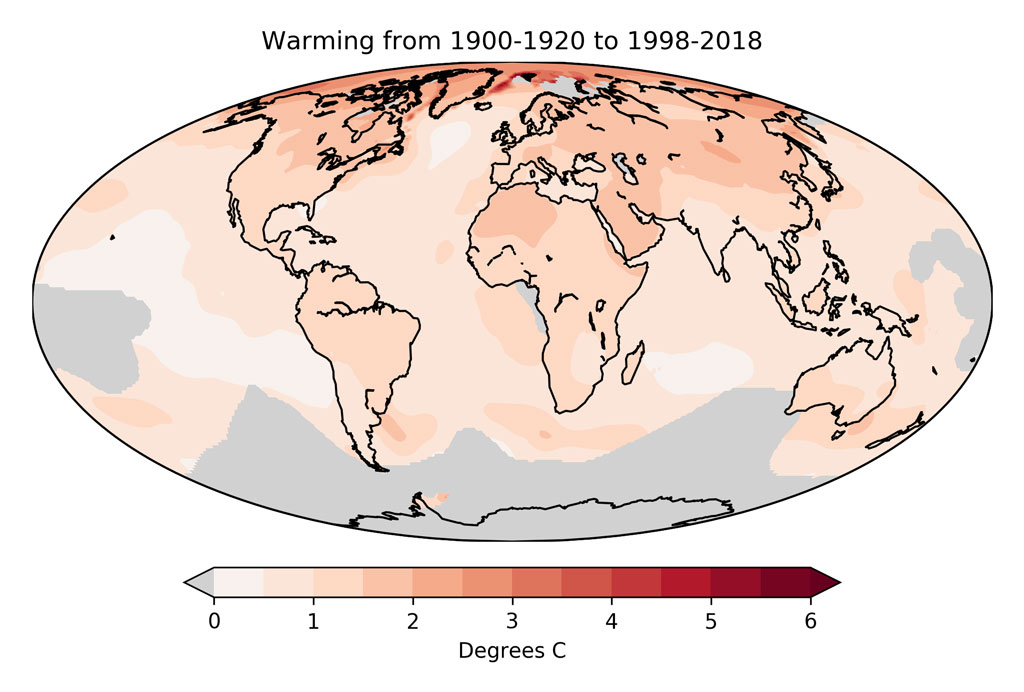
Warming between 1900-1920 and 1998-2018 based on 1 degree latitude/longitude gridded observational temperature data fromBerkeley Earth.
Over this period, on average, the world has warmed about 1C. However, land areas have warmed by 1.3C, while oceans have only warmed by around 0.8C. Some parts of the Arctic have warmed by more than 2C, with a few hotspots of even greater warming where cooler sea ice has been replaced by warmer open water.
By the end of the 21st century,climate modelsproject future average global warming between around 1.5C and 5C, depending on greenhouse gas emissions and thesensitivity of the climate这些排放。这些模型显示局域网d warming faster than oceans and polar amplification continuing into the future.
The figure below shows the average warming between 1900-1920 and 2080-2100 experienced across all of the climate models – calledCMIP5 models– featured in the Intergovernmental Panel on Climate Change (IPCC)fifth assessment report. It looks at warming across the four differentRepresentative Concentration Pathway(RCP) future emission scenarios. These span a world of rapid reductions in emissions where warming is held well-below 2C –RCP2.6– to a world where emissions increase rapidly through the 21st century –RCP8.5.
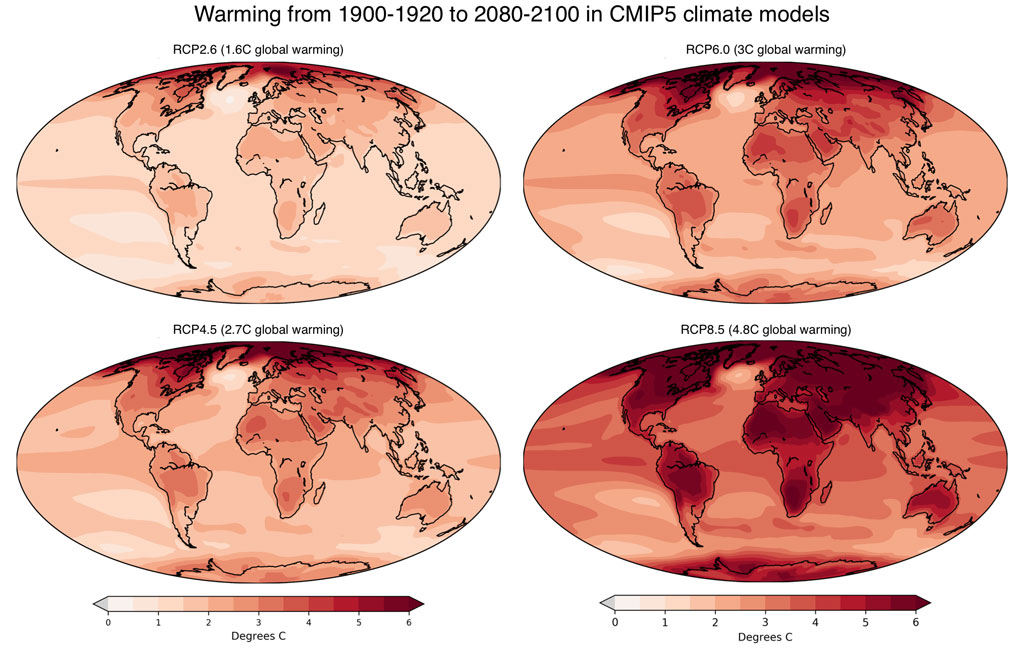
Warming between 1900-1920 and 2080-2100 in theCMIP5multimodel mean (one member per model) using data obtained fromKNMI Climate Explorer.
Population concentrated in specific areas
Global population tends to be concentrated in specific parts of the world. A large portion of the world’s population is located in India, China and southeast Asia, with much of the rest concentrated in large cities. The figure below shows where global population is expected to be located in 2020, according to projections fromNASA and Columbia University.
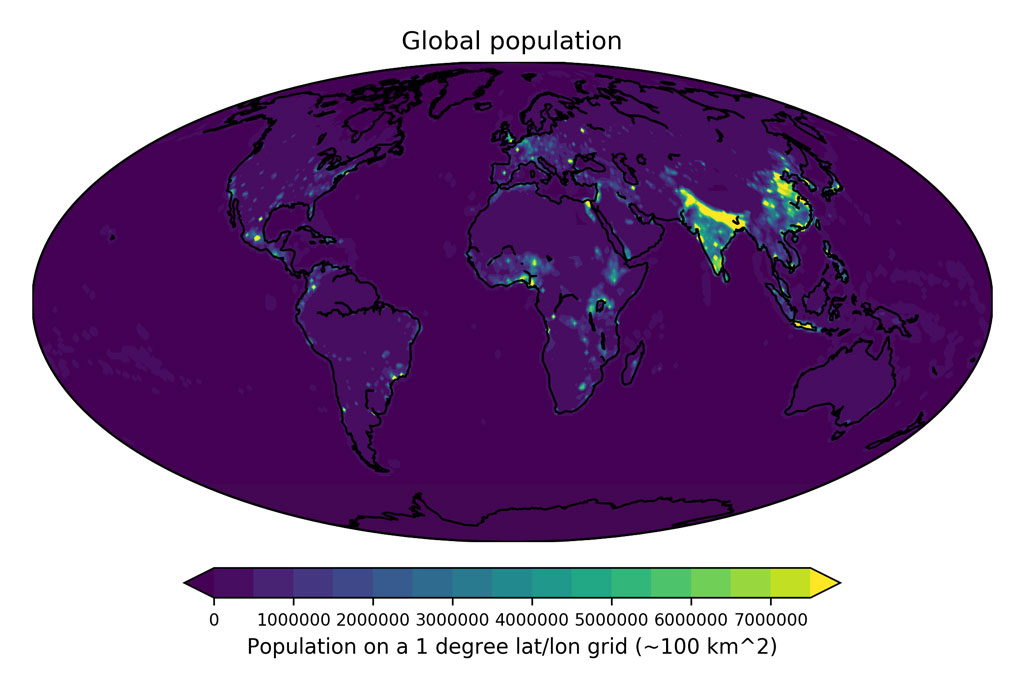
2020 projected population per 1×1 latitude/longitude grid cell (around 100 square kilometers) using data from theGridded Population of the World version 4(家庭医生Wv4).
As land areas warm faster than oceans, the fact that people live on land means that they will tend to experience faster warming than the global average change. This is somewhat mitigated by the fact that areas of highest population – India, southern China and southeast Asia – generally experience somewhat lower warming in the future than most other land areas. At least, that is according to the average across all the models.
While predicting exactly how the distribution of population will change by the end of the century is difficult, the existing population locations are still likely to be among the heaviest populated in 2100. However, rapid population growth is also expected in Africa, which may be home toup to 40%of the world’s population by 2100.
Warming where people live
Carbon Brief has combined the 2020 population map with climate model projections to estimate how much warming people will experience by the end of the 21st century. This follows similar efforts byDr Flavio LehnerandProf Thomas Stockerina 2015 paper,Dr Luke Harringtonand colleaguesin 2016, andProf David Frameand colleaguesin 2017.
The figure below shows the percent of the world’s population experiencing different levels of warming, both during the current period – the left-most column – and under the four different RCP future emission scenarios.
Warming experienced by the global population at present day and in different future RCP scenarios. Based on 2020 projected population data fromGPWv4andCMIP5 multimodel meanwarming between 1900-1920 and 2080-2100.Today, nearly all of the global population has experienced warming of at least 0.5C and about 68% has experienced warming of at least 1C. Around 16% of the population lives in areas that have already warmed more than 1.5C (light blue shading).
In future, the warming people experience depends on how much greenhouse gases are emitted. In a low-emission RCP2.6 scenario, where global temperatures stay well below 2C, about 14% of the population will still experience warming exceeding 2C (yellow).
For RCP4.5, nearly the entire global population experiences warming over 2C, with 26% seeing warming over 3C (orange). In RCP6.0, 63% of the population has warming over 3C and 6% over 4C (red). In the high-emission RCP8.5 scenario, most of the human population would experience warming exceeding 4C, with 44% exceeding 5C (maroon) and 7% exceeding 6C (black).
在一个“常态”的世界,行动有限公司mbat climate change is not undertaken, future warming depends on a lot of factors including population growth, economic growth and technological development. Scientists haverecently publisheda new series of “baseline” no-climate-policy scenarios that generally fall between RCP6.0 and RCP8.5.
The effects of future warming will vary greatly. Understanding how much warming people will experience is useful in understanding its impacts. While the global distribution of population may look somewhat different by the end of the century, people will still typically experience higher levels of warming than the global average temperature change.
-
Analysis: ‘Global’ warming varies greatly depending where you live
-
Analysis: How much ‘global’ warming will people actually experience?