Guest post: These 553 steel plants are responsible for 9% of global CO2 emissions

Caitlin Swalec
06.29.21
Caitlin Swalec
29.06.2021 | 12:00pmThe iron and steel industry is responsible for11%of global carbon dioxide (CO2) emissions and will need to change rapidly to align with the world’s climate goals.
To understand the scale of the problem,Global Energy Monitorhas mapped 553 steel plants representing 82% of the world’s installed capacity, as well as 42 proposed developments.
We published the findings today in ourfirst comprehensive reporton the sector, based on our recently releasedGlobal Steel Plant Tracker(GSPT), showing that most current and planned steel plants use the high-carbonblast furnace basic oxygen furnace(BF-BOF) process.
In contrast, our analysis of steel decarbonisation scenarios shows the industry’s emissions falling around 90% by 2050, in pathways that keep warming below 1.5C.
We also partnered with theGreen Steel Trackerto show the size and location of investments in novel low-carbon steelmaking processes, with many projects due to come online by 2030.
With the industry already more than 20% overcapacity and the majority of operating steel plants facing repowering or retirement this decade, the steel sector is poised to either lock in continued emissions or put an estimated $70bn of investment at risk of stranding.
Steel tracker
The GSPT is a survey of all crude steel plants on the globe with capacity of at least one million tonnes per annum (Mtpa).
It currently provides data on553 operatingplants with thecapacity to produce2,010Mtpa of crude steel, representing82%of total global capacity (2,453Mtpa).
Operating steel plants in China account for more than half the global total in the tracker (51%; 1,023Mtpa), followed by Japan (6%; 117Mtpa) and India (4%; 90Mtpa).
We also found that more than 60% of installed steelmaking capacity uses the high-carbonBF-BOF method, in which iron ore is smelted with heat from burning coal, which also acts as the “再保险ducing” agent needed to turn the ore into metal. China’s steel fleet is particularly reliant on this method and it notably accounts for 62% of global BF-BOF capacity.
Use of BF-BOF is the principle reason why the 553 plants we mapped are responsible for an estimated 3bn tonnes of CO2 (GtCO2), equivalent to 9% of global CO2 emissions.
The GSPT also provides data on 42 plants currently under development, totalling 130Mtpa, equivalent to 5% of current global capacity. Thesedevelopmentsare mainly in China (39%), India (22%) and other parts of southeast Asia, as shown in the chart below.
At least 65% of this capacity under development would use the BF-BOF method (orange bars), of which some 88% (44Mtpa) is in China. (The figure for India is likely to be higher than shown given that the method for its remaining 26Mtpa of proposed capacity has not been disclosed.)
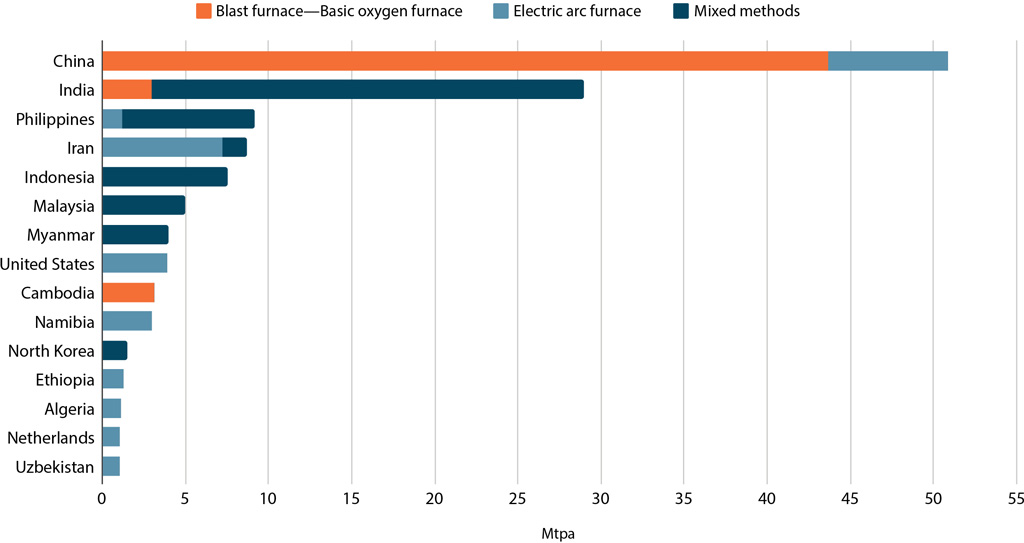
In terms of plants under development using theelectric arc furnacemethod (EAF, light blue bars above), China and Iran each plan 7.2Mpta of capacity, together accounting for 53% of the EAF total.
Note that only a minority of the steel plants in the pipeline are currently being built (42%, 55Mtpa) and most of these are in China (76%, 42Mtpa).
Paris pathways
Global CO2 emissions need to hitnet-zero by around 2050to keep warming below 1.5C, in line with the stretch goal of theParis Agreement, or by 2070 to limit it to “well below” 2C.
This poses obvious questions for the steel sector, given its responsibility for 11% of global CO2 emissions. Yet there have been relatively few efforts to translate overall global emissions scenarios into Paris-compliant sectoral pathways, for the steel industry or others.
To date, theInternational Energy Agency(IEA) has set out the most comprehensive roadmaps for decarbonising the steel sector, intwopublicationsissued over the past year.
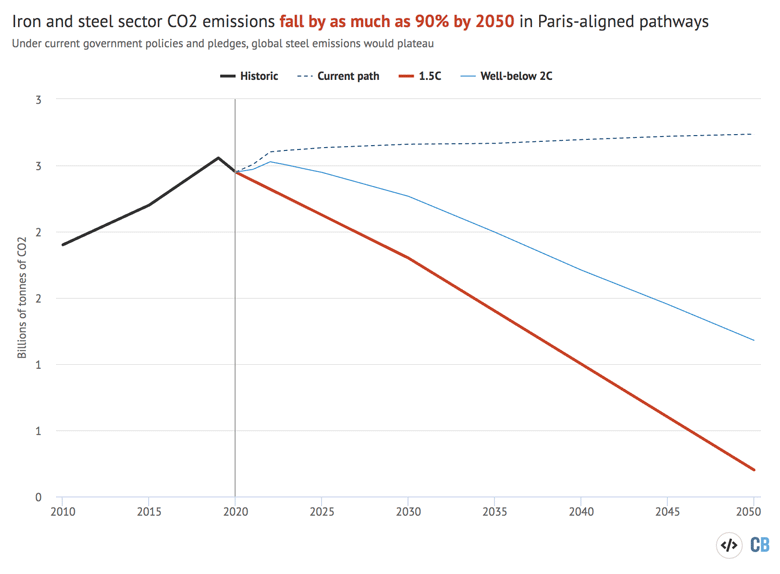
These IEA reports plot out dramatic reductions in CO2 emissions from the iron and steel sector by 2050, dropping to 54% below 2019 levels in a well-below 2C scenario (light blue line in the chart, below) or by some 90% for 1.5C (red).
In contrast, the IEA says the industry’s emissions will plateau for the next few decades under current government policies and pledges (dark blue).
Three quarters of global steel capacity in the GSPT, some 1,503Mtpa, is located incountriesthat have pledged to be carbon neutral by 2050 or 2060.
Additionally, at least 16 major steelcompanies, some of which operate plants in countries without carbon neutrality pledges, have pledged to be carbon neutral by 2050.
Combined, company and national-level pledges to decarbonise the steel sector now cover more than three-quarters of operating steel capacity.
Yet if the iron and steel assets currently operating and under development are run for their typical lifetime of 40 years, without intervention, then their cumulative emissions could reach around65GtCO2by 2060, against a再保险maining carbon budgetfor 1.5C of around 440GtCO2.
In order to meet Paris-compliant trajectories, the steel sector will therefore require the rapid deployment and development of clean steelmaking technologies. Lower-emissions methods include both those that are already available and those under development.
BF-BOF production requires coal not only for heat but its chemical reaction, making it difficult to decarbonise. In contrast, emissions from EAF steelmaking depend on the power source and feed materials, offering a wider range of decarbonisation options.
In an EAF, steel can be made using either recycled scrap metal or iron ore reduced by a gas, known asdirect reduced iron(DRI). Technologies for lowering emissions from DRI include usinghydrogengas produced from renewable power, or natural gas combined withcarbon capture and storage, although neither have reached commercial scale yet.
Both of these technologies will be crucial for a Paris-compliant steel sector, according to the IEA, but it also sees a need for a range of other strategies to cut emissions.
These include reducing demand for crude steel through efficient material design and increased scrap recycling, as well as improving steel production efficiency through the use of “best available technologies” (BAT) and general operational improvements.
GEM’s steel tracking team pulled together the first thorough comparison (see table below) of the decarbonisation pathways set out by the IEA, which reveals the contributions from each of these options towards decarbonising the steel sector in line with the Paris Agreement.
| Sustainable Development Scenario (SDS) | 更快的创新案例 | Net-zero by 2050 Scenario (NZE) | |
|---|---|---|---|
| Report source | Iron and Steel Technology Roadmap | Iron and Steel Technology Roadmap | Net-zero by 2050 |
| Energy system goal | 2C / net-zero 2070 | 1.5C / net-zero 2050 | 1.5C / net-zero 2050 |
| Steel sector direct CO2 emissions and reduction relative to 2019 | 2.3GtCO2 in 2030 1.2GtCO2 in 2050 0.3GtCO2 in 2070 (54% by 2050) |
0.3GtCO2 in 2050 (89% by 2050) |
1.8GtCO2 in 2030 0.2GtCO2 in 2050 (92% by 2050) |
| Share of steel made with EAF | 29% in 2019; 57% by 2050 | Assumed same as SDS | 24% in 2020; 37% by 2030; 53% by 2050 |
| Scrap as share of input | 32% in 2019; 45% by 2050 | Assumed same as SDS | 32% in 2020; 38% by 2030; 46% by 2050 |
| Material efficiency | Responsible for 40% of cumulative emissions reductions relative to 2019 baseline by 2050 | Reduces steel demand by 19% relative to 2019 by 2050 | Reduces steel demand by 20% relative to 2020 by 2050 |
| 技术性能改进(“蝙蝠”和喜神贝斯t practices) | 21% of cumulative emissions reductions by 2050 | Cites the importance of installing BAT and optimising efficiency but does not estimate emissions savings | |
| Technologies still in development or prototype | Responsible for 30% of cumulative emissions reductions by 2050 Responsible for around 40% of annual emissions savings in 2050 |
Introduced to market by 2026 Responsible for around 75% of annual emissions savings in 2050 |
Responsible for 54% of cumulative emissions reductions by 2050 |
| Hydrogen-based DRI | Responsible for 8% of cumulative emissions reductions by 2050 Introduced to market by 2030, with 15% of steelmaking capacity equipped by 2050 One electrolytic hydrogen-based DRI plant built per month after market introduction |
Introduced to market by 2026 Two 100% renewable hydrogen-based DRI plants built per month after introduction |
29% steelmaking capacity equipped by 2050 |
| CCUS (including blue hydrogen DRI) | Responsible for 16% of cumulative emissions reductions by 2050 Introduced to market by 2030 One 1MtCO2 captured per year CCUS project installed every 2-3 weeks after market introduction Reaches 400MtCO2 captured per year by 2050 |
Introduced to market by 2025 Two 1MtCO2 CCUS projects built every month after market introduction |
53% steelmaking capacity equipped by 2050 Reaches capture total of 670MtCO2 per year by 2050 |
| Iron ore electrolysis | Not deployed | 5% of steelmaking capacity equipped by 2050 Introduced to market by 2030 One plant built every two months from 2030 to 2050 |
13% of steelmaking capacity equipped by 2050 |
The IEA再保险portsthat total emissions from the iron and steel sector were 3.7GtCO2 in 2019, including 2.6GtCO2 released directly at steel plants and another 1.1GtCO2 released indirectly, for example at power plants supplying electricity for steelmaking.
For the central column in the table, emissions reductions under the “faster innovation case” are based on the IEAstatingthat direct global emissions from the iron and steel sector “fall to reach a level in 2050 that is 75% lower than in the Sustainable Development Scenario”.
The far right column of the table above is based on the IEA’snet-zero by 2050 report(NZE), which reported direct steel sector emissions in 2020 of 2.4GtCO2.
In the NZE pathway, emissions from heavy industry – including steel, chemicals and cement – fall 20% by 2030 and 93% by 2050, relative to a 2020 baseline. For ease of comparison in the table, figures in this column were recalculated relative to a 2019 baseline.
Stranded assets
Even without the challenge of getting on a Paris-compliant pathway, the global steel sector is already facingeconomic straindue tosignificant overcapacity.
Global steelmaking capacity in 2020 of 2,543Mtpa exceeded production of 1,918Mtpa bymore than 25%. Even in the pre-Covid figures for 2019 there was significant overcapacity, shown in the chart below, with more than 25% excess capacity in the EU27+UK and up to 20% in China.
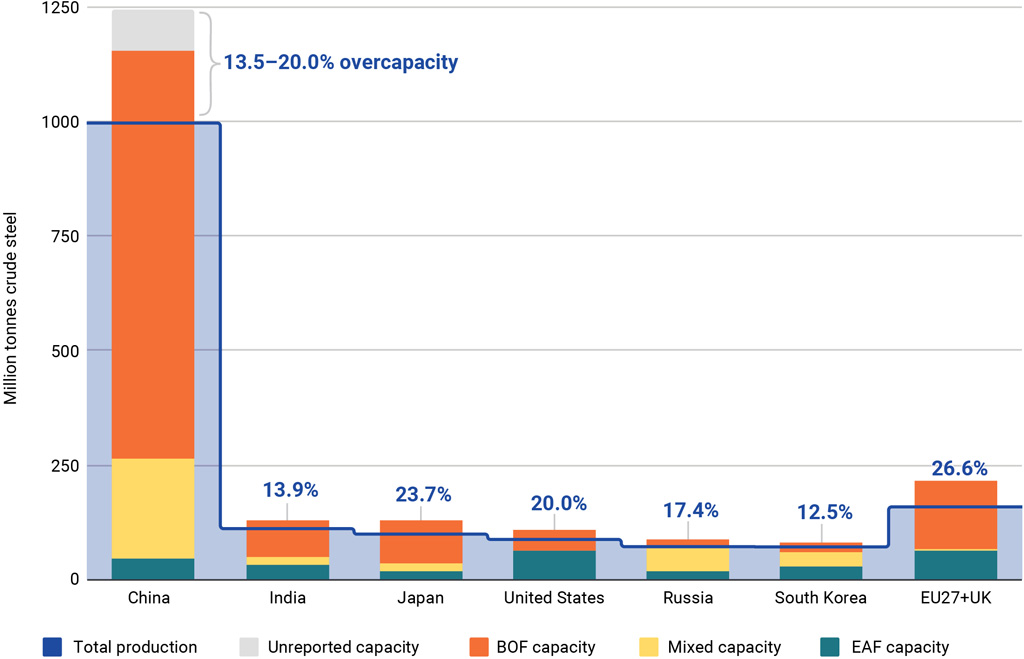
The levels of existing overcapacity in the global steel sector raises question marks over the need for new plants in the pipeline, particularly those using high-carbon BF-BOF technology.
We estimate that BF-BOF plants in the pipeline represent up to $70bn in investment for steel producers, which risks being stranded by overcapacity and climate constraints.
Indeed, the figures in the chart above suggest capacity in the pipeline could be cancelled and many older and polluting steel plants could be closed, without disrupting global supply.
(Although steel output has been surging in China on the back ofpost-Covid stimulus, the industry is also facing a nationwide2060 carbon neutrality pledgeand asectoral planto peak emissions by 2025 before cutting them 30% by 2030.)
In addition, furnaces in the majority of the world’s steel plants will reach the end of their investment cycle by 2030, raising the question of whether to reinvest in keeping them open or whether to opt instead for lower-carbon technologies.
The age profile of the global steel sector is shown in the chart below, where the width of each bar indicates production capacity and the height shows age. Each region is colour-coded, with Asia Pacific shown in red.
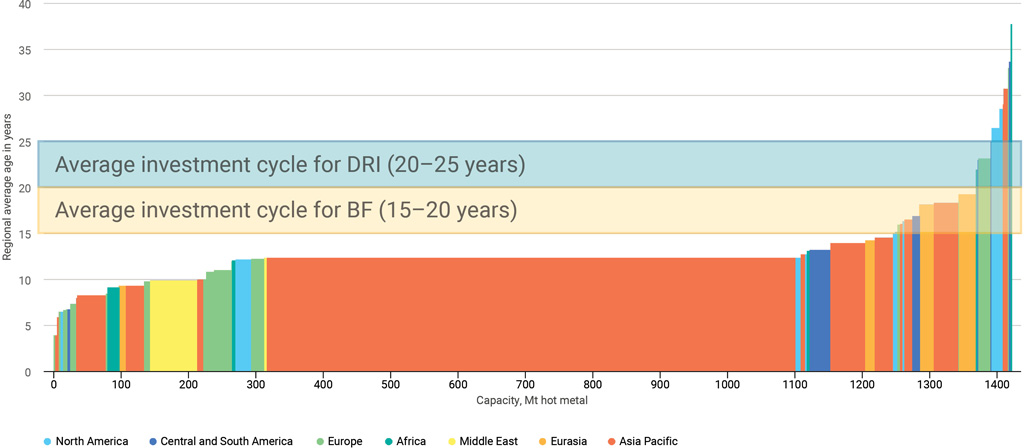
The chart also shows the investment cycle for steel production sites, which is approximately 15–20 years for BF-BOF plants and 20–25 for DRI, over an average 40 year plant lifetime.
This timescale means that over the next decade, steel plant owners will need to make difficult decisions about whether coal-based furnaces should be prolonged, retrofitted, or replaced with lower-emissions technology.
这些决策dependin必须小心地管理g on how innovative technologies have advanced, to avoid locking in emissions from capacity that could be stranded by climate goals.
Green steel
Over the next decade or two, novel, low-emissions technologies such as hydrogen-based DRI from renewables and gas-based DRI with carbon capture and storage are projected to reach commercial scale, if pilot and demonstration projects prove successful.
TheGreen Steel Tracker, a partner initiative of the GSPT developed in collaboration with theStockholm Environment InstituteandLeadIT Secretariat, tracks investments and progress on low-emissions steelmaking and shows that many projects are set to come online by 2030.
The figure below shows the size and location of green steel investments around the world, with the colours indicating the type of project ranging from R&D (blue) through to pilot scale (pink).
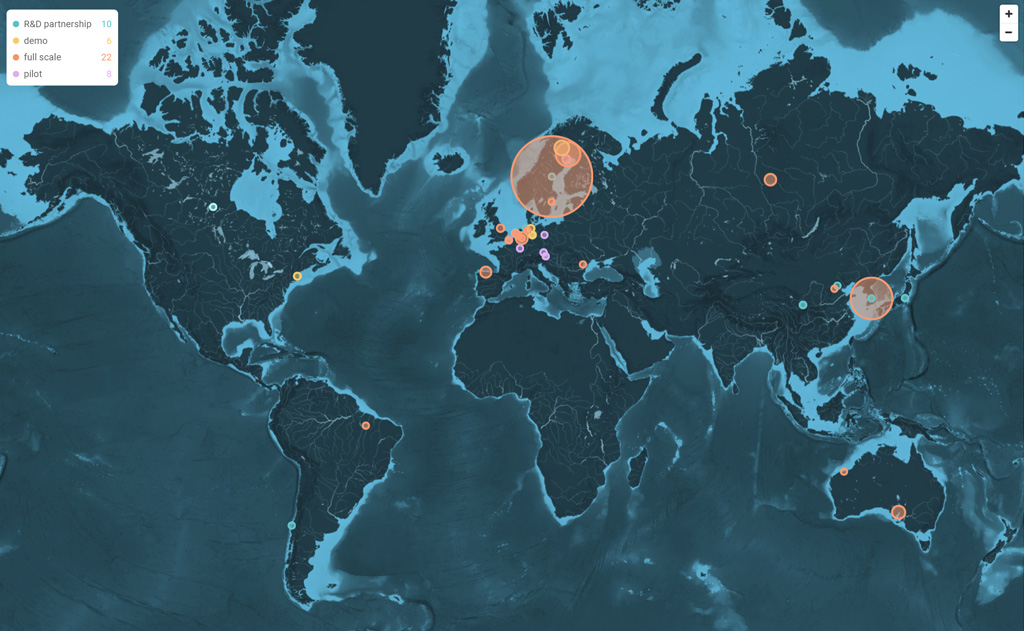
If innovative low-emissions technologies reach commercial scale at the projected pace, the steel industry faces billions of dollars in stranded asset risk, not only for plants currently under development but also for plants that will face reinvestment cycles in the decade to 2030.
-
Guest post: These 553 steel plants are responsible for 9% of global CO2 emissions