Guest post: A Met Office review of the UK’s weather in 2018

Dr Mark McCarthy
01.04.19
Dr Mark McCarthy
04.01.2019 | 4:54pmDr Mark McCarthyis science manager of the Met Office National Climate Information Centre, which provides monitoring and analysis of UK climate variability and change.
2018 came to a close with a notably mild December, bringing an end to a warmer, drier and sunnier year than average for the UK.
But 365 days is a lot of weather to summarise in just three words. So, in the following article, I take a look back at some of the defining weather and climate events of the year – and how have they contributed to these main takeaways.
Annual average
The year 2018 is provisionally ranked as the UK’s seventh warmest year in the Met Office national series, which goes back to 1910. It was also the second sunniest year since records began in 1929, behind only 2003.
As the maps below illustrate, the highest temperature anomalies were in south-east England, while the driest and sunniest places – relative to average – were in East Anglia and northern Scotland.
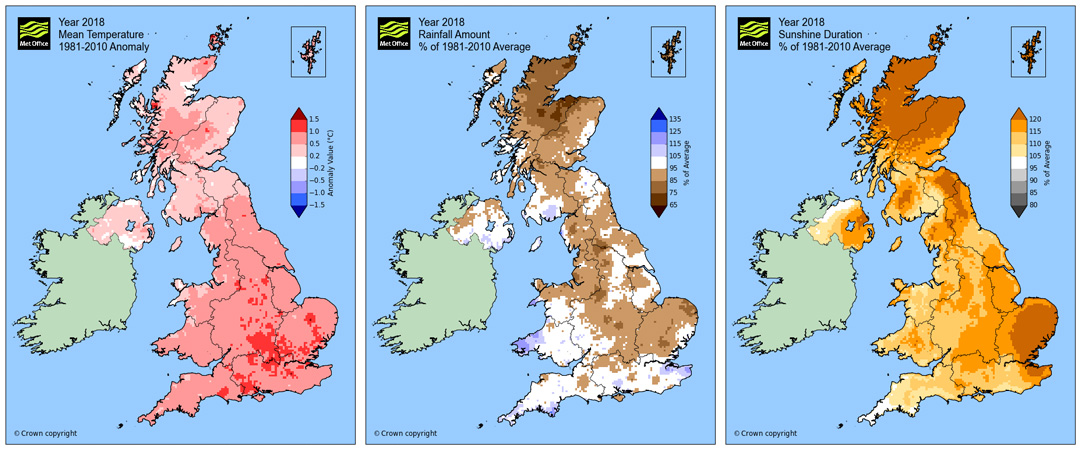
Maps of UK annual average temperature (left) rainfall (middle) and sunshine duration (right) for 2018. Credit: Met Office
| 平均温度 | Rainfall | Sunshine | |||
|---|---|---|---|---|---|
| Absolute (C) | Anomaly (C) | Absolute (mm) | Anomaly (%) | Absolute (hours) | Anomaly (%) |
| 9.5 | 0.6 | 1064 | 92 | 1581 | 115 |
Overall, last year was slightly cooler – by approximately 0.07C – than 2017. All 10 of the warmest years on record for the UK have now occurred since 2002, and 2014 is still the UK’s warmest year.
| Year | 平均温度(degrees C) | |||
|---|---|---|---|---|
| 2014 | 9.91 | |||
| 2006 | 9.73 | |||
| 2011 | 9.64 | |||
| 2007 | 9.59 | |||
| 2017 | 9.56 | |||
| 2003 | 9.50 | |||
| 2018 | 9.49 | |||
| 2004 | 9.47 | |||
| 2002 | 9.47 | |||
| 2005 | 9.45 |
By looking at individual months of the year, we can pinpoint the major climate events that contributed to the annual averages. The series of maps below show average conditions for each month of the year for temperature (top row), rainfall (middle) and sunshine duration (bottom).
The warm, dry and sunny conditions through May to July stand out in particular. Sunny conditions centred on the longest days of the year helped boost the annual average. For example, 2018 had the sunniestMayon record, the fifth sunniestJune, and the sixth sunniestJuly.
For rainfall,Junewas the third driest on record for England. In the annual statistics, this was partially offset by the seventh wettestMarch.As quite often happens, north-west Scotland exhibits an opposite pattern of rainfall anomalies between these two months. This serves as a handy reminder that UK-wide statistics can mask important regional detail, particularly where rainfall is concerned.
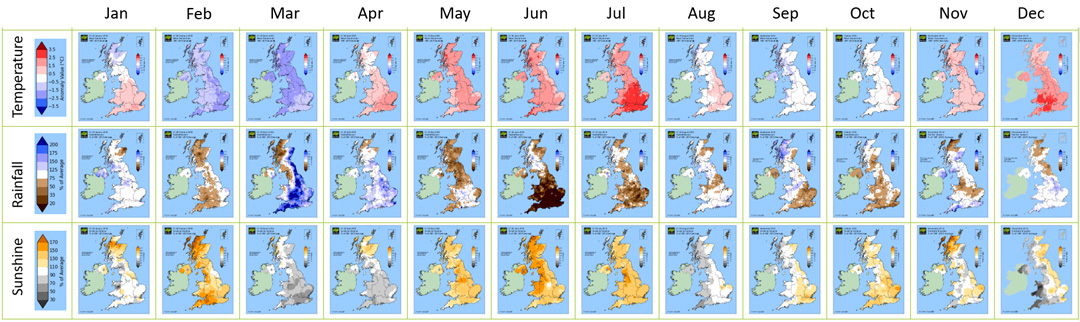
英国的地图月度温度(上)、降雨(middle) and sunshine (bottom) anomalies from January to December, relative to 1981-2010. Credit: Met Office
Cold and Snow
FebruaryandMarch在2018年唯一一个月widespread lower-than-average temperatures. The UK experienced aspell of severe winter weatherwith low temperatures, strong easterly winds and significant accumulations of snow. This “Beast from the East”, as it became known, was the most significant spell of snow and low temperatures for the UK since 2010.
The blast of cold weather was ultimately a result of a “sudden stratospheric warming” event that occurred over the north pole in mid February. In a series of connected events, high pressure subsequently became established over Scandinavia and northern Europe. This drew extremely cold air from Finland and northern Russia across continental Europe and to the UK.
The low temperatures meant that most precipitation fell as snow. The snow cover across southern England was substantially enhanced in early March by a low pressure system – named “Storm Emma” by thePortuguese Met Service– bringing moist air from the south.
Furthermore, the easterly winds across the UK were strong, resulting in drifting and deep accumulations of snow, coupled with low temperatures and wind chill. The Met Office issuedtwo red warnings for snowduring this event.
The chart below shows the UK average daily temperature, relative to 1981-2010, for the first four months of 2018.
The lowest temperature of the year for anywhere in the UK was recorded on 28 February with -14.2C in Faversham, Kent. On 1 March, the first day of meteorological spring, parts of the west Midlands and south Wales recorded daily maximum temperatures that were more than 12C below the March average. And a new record low daytime maximum temperature of -4.7C was measured in Tredegar, south Wales.
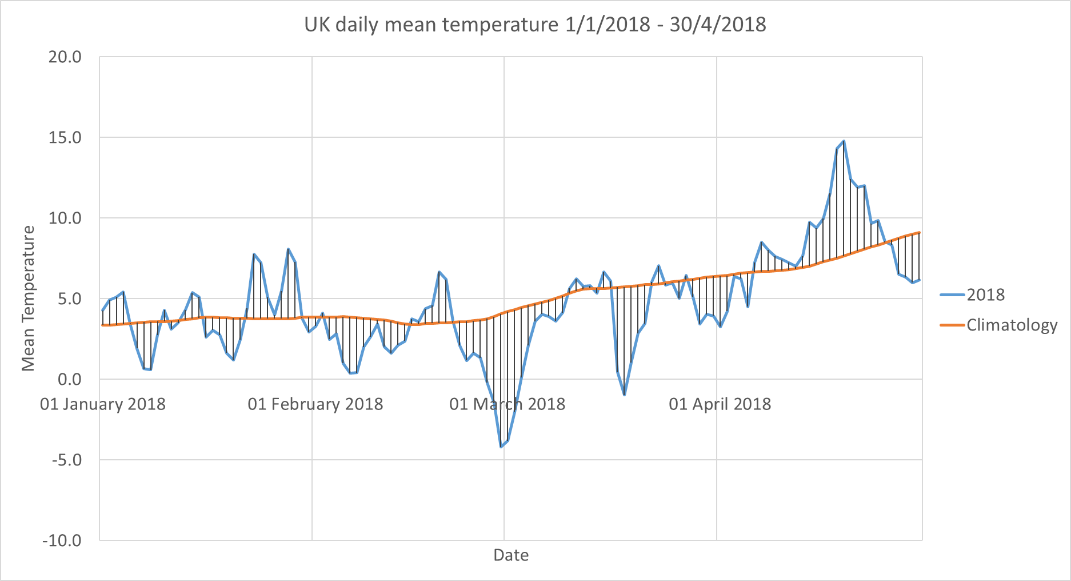
Daily average UK temperature averaged for January to April 2018 (blue). Hatching shows departure from the 1981-2010 average, which itself is shown as the orange line. Credit: Met Office
The daily temperature series illustrates that the event was relatively short lived with below-freezing temperatures for just a couple of days. Although the low temperatures were notable, the 2018 event was not comparable in length to previous cold extremes, such as winter of 2010, when sub-zero temperatures lasted for more than a week, or the extreme winter of 1963, which lasted from late December through to early February.
In November of 2018, the Met Office published a report onclimate extremeswhich found that there had been a decline in the number of “icing days” – where the maximum temperature is below zero – in the UK. Provisional analysis for 2018 puts the icing day count at 4.3 days, which is above the 1981-2010 average of 3.6 days and the highest since the 4.6 days in 2013 – but far fewer than the 14.2 days seen in 2010.
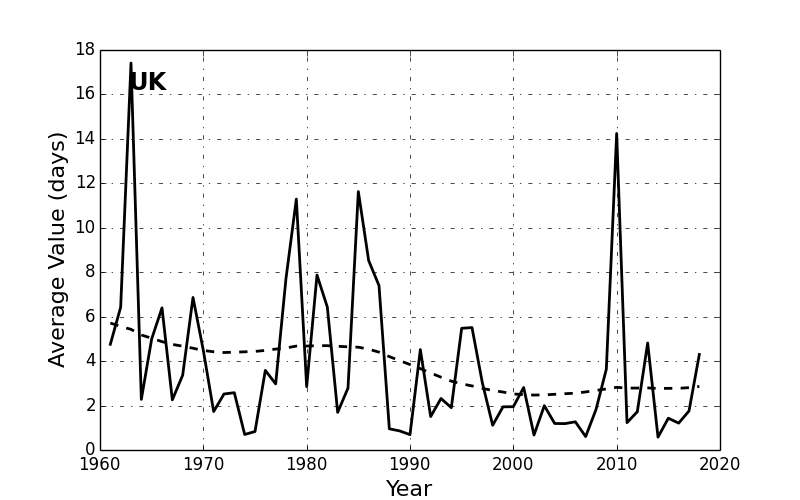
Annual icing days index for the UK from 1961-2018 inclusive. Credit: Met Office
Hot and Dry
In a dramatic turn of events after the cold weather of March, a hot southerly flow during 18-20 April saw remarkably high temperatures for the time of year. In St James’s Park in London, temperatures reached 29.1C – making it the hottest April day since 1949. Temperatures were 25-28C across south-east England and reached 25C as far north as Whitby in Yorkshire.
This set the stage for May, which, after an unsettled start, saw two further spells of warm weather. By happy coincidence, these aligned with the two bank holidays of the month and resulted in thewarmest early May bank holidaysince it was introduced in 1978. It was the joint warmest May on record for both Scotland and England and the sunniest on record for the UK as a whole.
After May, the weather became settled and high pressure dominated the summer. As you can see in the map below, June was exceptionally dry for southern England, with little or no rain from late May into July.
In the south, some rain gauges recorded more than 50 consecutive dry days and parts of Hampshire, London and Cambridgeshire received less than 1mm during June. For the summer overall, it was the driest since 2003 and sunniest since 1995.
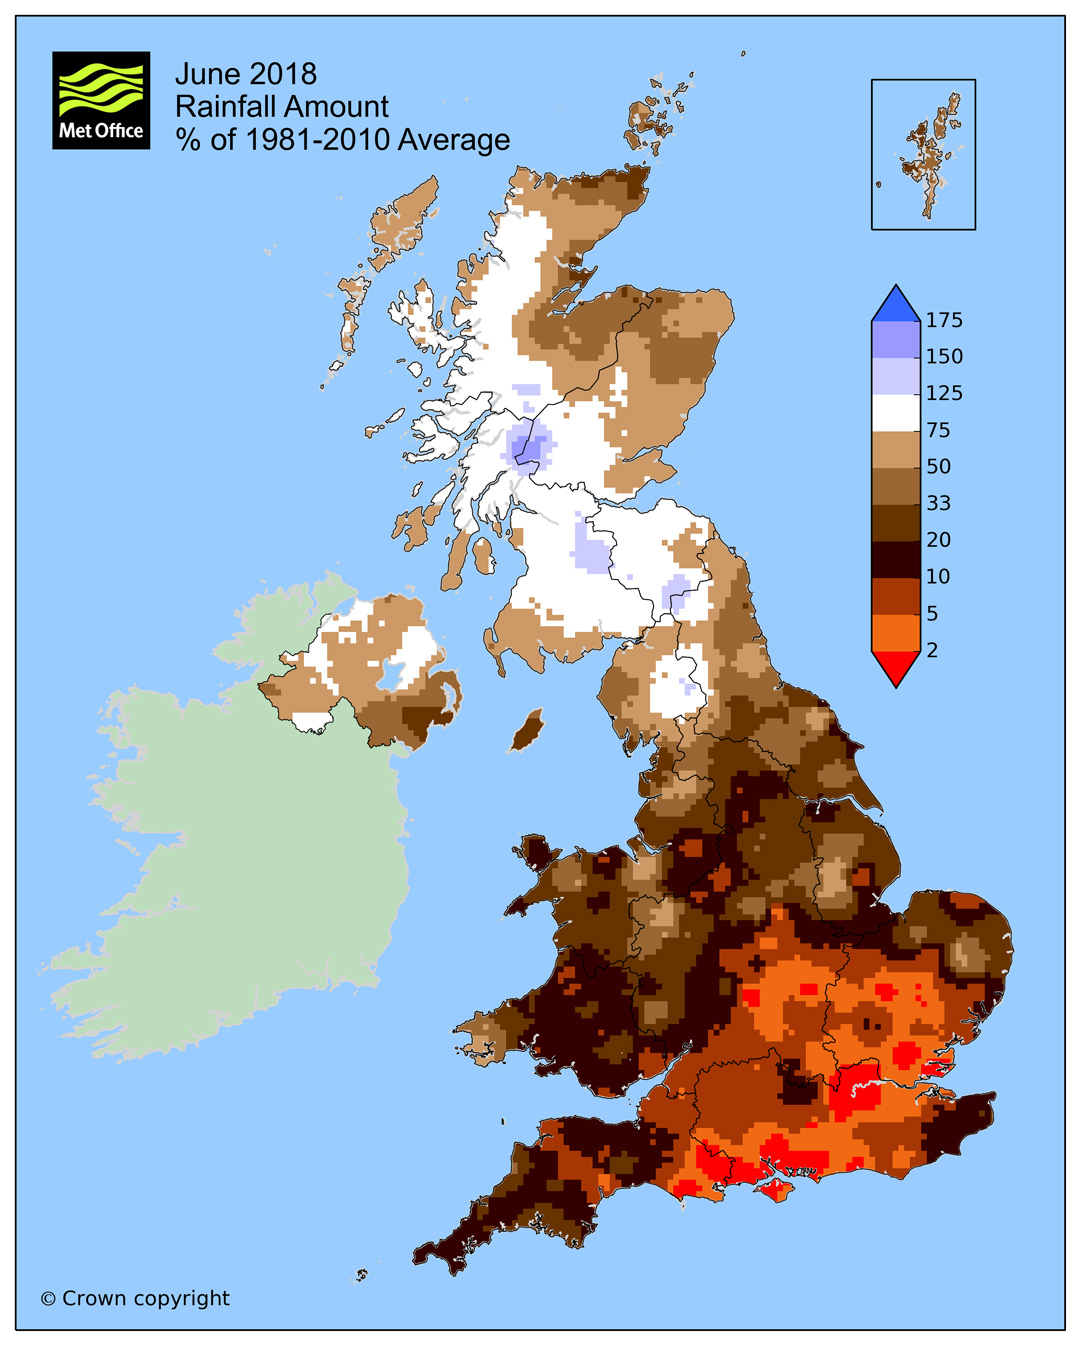
Map of UK June rainfall anomalies as a percentage of 1981-2010 average Credit: Met Office
An easterly flow, with high pressure to the north of the UK in late June, saw temperatures in the north and west reach 31.9C in Glasgow and 33C in Porthmadog on 28 June. Unusually, temperatures across Northern Ireland also exceeded 30C.
The fine and hot weather persisted through July and into early August, with the highest temperature of the year – 35.6C – recorded in Felsham, Suffolk on 27 July. Heat extremes were also feltacross much of the northern hemisphere.
However, in contrast to the other extreme summers such as 2003 or 2006, the UK did not experience any extended spells of exceptionally high temperatures in 2018.
The summer overall was the equal-warmest for the UK, tying with 2006, 2003 and 1976. For England, it was the warmest summer and equal fourth warmest in theCentral England Temperatureseries from 1659.
To understand why the summer was so warm and dry over the UK, there are a number of factors to consider.
Primarily, thejet stream– a fast-flowing river of air high up in the atmosphere – weakened and stayed north of the UK, allowing high pressure to become established over the UK and Europe.
In late spring and early summer, a distinctive “tripole” pattern of sea surface temperatures was observed across the north Atlantic. This comprised a band of warmer than average conditions at mid-latitudes, with cooler than average conditions to the north and south.
This pattern isknown to influence the jet stream and surface air pressure patternsconsistent with what happened in 2018 and has some striking similarities to the situation early on in the UK’s record-hot summer of 1976. You can see this below in the maps of June temperature anomalies in 1976 (left) and 2018 (right).
And, finally, the sea surface temperatures in the immediate vicinity of the UK were also well above average for the time of year, which will have also helped elevate UK temperatures during the summer.
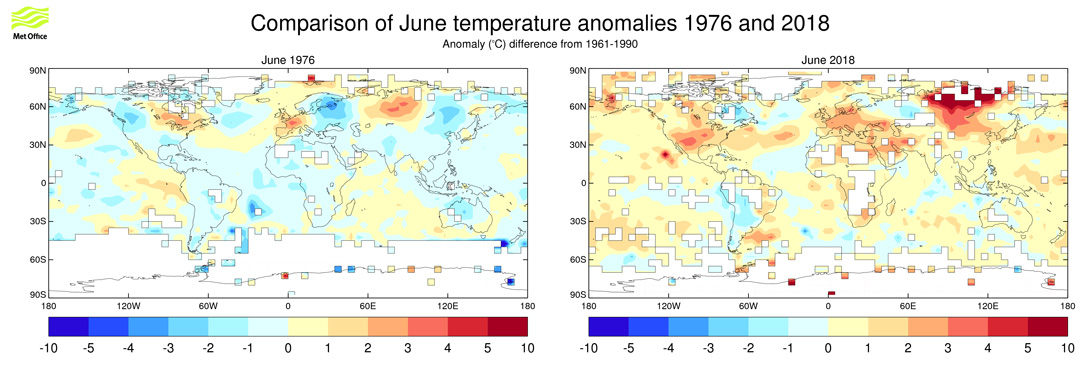
June surface air temperature anomalies in 1976 (left) and 2018 (right), relative to 1961-90. Credit: Met Office
A crucial factor in the magnitude of the heatwave is that the 2018 summer weather was playing out in a warmer world. Human-induced climate change has made summer temperatures like those of 2018 about30 times more可能比预计将从natural fluctuations in climate alone.
Storms
A total of 10 named storms affected the UK during 2018 – of which four occurred in January. (Large stormsare namedto help communication of approaching severe weather.)
| Name | Date of UK impacts |
|---|---|
| Eleanor | 2-3 January |
| Fionn | 16 January |
| David (named by Meteo France) | 18 January |
| Georgina | 24 January |
| Emma (named by Portuguese Met Service) | 1-2 March |
| Hector | 13 June |
| Ali | 19 September |
| Bronagh | 20-21 September |
| Callum | 12-13 October |
| Deirdre | 15 December |
Storm HectorandStorm Aliwere notable as unusually severe storms for the time of year, bringing close to record-breaking wind gusts for June, and one of the most notable September storms in recent decades, respectively.
And, finally,Storm Callumbrought persistent and heavy rain to western areas in October, resulting in disruption from both strong winds and flooding. The Brecon Beacons in south Wales were particularly affected with 150-200mm falling over a 48-hour period. In addition, temperatures widely exceeded 25C on 13 October, unusually high for the time of year.
In summary, the year 2018 saw both some high and low temperature records broken. However, the prevalence of warmer days in general – that were not restricted to the summer heatwave – continue a pattern of a warmer UK climate and contributed to a Top 10 warmest year for the UK, which was warmer than any year of the 20th Century.
-
Guest post: A Met Office review of the UK’s weather in 2018
-
Guest post: Reviewing the UK’s weather in 2018