Analysis: Why climate-finance ‘flows’ are falling short of $100bn pledge
Josh Gabbatiss
10.25.21Josh Gabbatiss
25.10.2021 | 5:33pmOne of the biggest and most contentious issues in climate politics is the provision of money to help poorer countries cut emissions and protect themselves from climate impacts.
In 2009, wealthy nationspledgedto “mobilise” $100bn in “climate finance” annually by 2020 to help vulnerable nations deal with climate change.
Nearly one year on from the deadline, a “delivery plan” released ahead of the COP26 climate summit has concluded that the target willnot be metuntil 2023.
Politiciansandobservershave warned that this failure couldundermine trustbetween nations as they head into negotiations in Glasgow.
What is more, there are widespreadconcernsabout thequality of financebeing offered, with questions surrounding the use of loans instead of grants, different definitions of “climate finance” and insufficient funding for adaptation efforts.
In this article, which updates and builds on aprevious analysispublished in 2018, Carbon Brief assesses the state of international climate finance as nations prepare for COP26.
It uses the latest numbers collated by theOrganisation for Economic Co-operation and Development(OECD), a club of mostly wealthy nations, many of which are responsible for contributing climate finance.
The first section examines the progress that has been made towards the $100bn target. The second uses detailed OECDproject-level datafor the years 2018 and 2019 to examine how finance is “flowing” around the world, including which nations are providing and receiving the most money and what form these funds are taking.
Progress towards the $100bn target
AtCOP15in Copenhagen in 2009, ”developed countries”committedto mobilising $100bn per year by 2020 “to address the needs of developing countries”, a pledge that was officially agreed a year later as part of theCancun Agreements.
The pledge, whilesomewhat arbitraryandfar shortof the actual needs of vulnerable nations, has become an important yardstick by which to measure developed countries’ overall commitment to climate action.
Under theUN Framework Convention on Climate Change(UNFCCC) only the 23Annex IInations – relatively wealthy countries that were part of the OECD when the treaty was signed in the early 1990s – are obliged to provide climate finance to poorer countries. However, other nations as well as private organisations can and do contribute.
Climate finance isoften framedas an issue of justice, with richer nations viewed as responsible for helping poorer nations address climate change. This argument was captured by UK prime minister Boris Johnson in aspeechat the UN in September:
“Richer nations have reaped the benefits of untrammelled pollution for generations, often at the expense of developing countries. As those countries now try to grow their economies in a clean, green and sustainable way we have a duty to support them in doing so – with our technology, with our expertise and with the money we have promised.”
Despite strongrhetoricfrom world leaders in the lead up to COP26, which will be hosted by Johnson’s government, experts uniformlyagreethat richer nations havefailedto reach the $100bn target.
Thanks to Ministers@JochenFlasbarth&@JonathanWNVfor agreeing to lead on developing a Climate Finance Delivery Plan to be published before#COP26
— Alok Sharma (@AlokSharma_RDG)July 27, 2021
Delivering on the USD 100bn/year commitment from 2020-2025 is a matter of trust#COP26pic.twitter.com/LKPGa7boUE
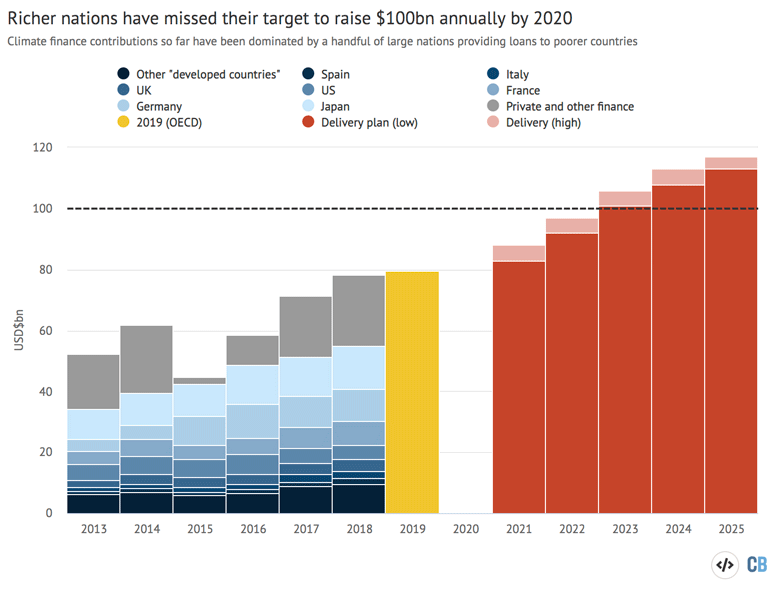
In 2019, the OECD found that climate finance hadreached$79.6bn, up just 2% from 2018, and while official figures for 2020 are not yet available,Bloombergreported that rich countries reckon they had raised $88-90bn, as of October 2021.
With one week to go until COP26, the UK presidency released a “delivery plan”, based onOECD analysis, to “provide clarity on when and how developed countries will meet the $100bn climate finance goal”. It confirmed that the target is not expected to be met on time.
The OECD report sets out two scenarios for 2021-25, involving different levels of public and private finance, supported by alist of commitmentsfrom wealthy countries for this period.
目前,许多发达国家萤火虫ing Italy and Spain are missing from the list. Carbon Brief understands that more pledges are expected at COP26 itself and these numbers may be updated accordingly.
The chart below shows the progress that has been made over the past few years, with national contributions through bilateral (country to country) and some multilateral (via international institutions) funds indicated in shades of blue.The remaining finance for 2013-2018 and the estimate for 2019 are based on OECD figures
红色条指示经合组织的场景coming four years and the dotted line indicates the 2020 target, which is not expected to be met in either scenario until 2023. Both scenarios would result in roughly $100bn being the average annual contribution across the five-year period.
These figures are up for debate because, despite the importance of the $100bn target, there isno clear, universal definition ofwhat countsas “climate finance”.
Perhaps the most comprehensive analysis is the UNFCCC’s ownbiennial assessmentof climate finance, although the year-long delay of COP26 means theversioncovering 2017-18 is not yet available. Figures for 2019-20 are not expected until 2022.
The annual totals for climate finance in the chart above for 2013-19 come from the OECD’smost recent reporton “climate finance provided and mobilised bydeveloped countries”, which has beenwidelycitedas the most up-to-date assessment of climate finance.
The shares attributed to countries are based onyabo亚博体育app下载by theWorld Resources Institute(WRI) of bilateral and multilateral development funds that can be traced to Annex II nations. These roughly align with the OECD’s figures, which are not broken down by country but, like the WRI’s, are partly derived from Annex II nations’ reports to the UNFCCC.
The remaining finance, indicated by the grey bars in the chart above, is made up ofexport credits, additional outflows from multilateral institutions and, most of all, private contributions by businesses and philanthropic groups (this is an approximation based on the OECD’s total values with the WRI estimates removed).
Private funds count towards the $100bn target, but the WRIdid notinclude them in its analysis as the data is less complete and difficult to attribute to individual nations. The OECDestimatesthat annual private finance has been stable at around $14bn since 2017.
While Japan, Germany and France appear to be by far the biggest contributors, the WRIwarnsthat the lack of clarity around climate finance reporting means the numbers should be approached with caution:
“It is important to bear in mind that approaches vary considerably between countries; whereas higher-reporting contributors may have a more liberal interpretation of what finance flows to include, lower-reporting contributors may have taken a more conservative approach.”
Climate finance figures arewidelycontested, with many global-south nations questioning how much fundingis newand not simply diverted from other development funds. Criticism has alsobeen levelledat the overreliance on loans and the inclusion of support for “high-efficiency” coal plants by Japan and Australia.
Others havequestionedthe inclusion of private funding, asDr Sreeja Jaiswal, a senior fellow at theMS Swaminathan Research Foundationin India, tells Carbon Brief:
“There are concerns that it will flow only to ‘bankable projects’ and might not align with needs and priorities of developing countries, support adaptation, flow to countries where it is most needed and will increase [the] debt burden of low-income countries.”
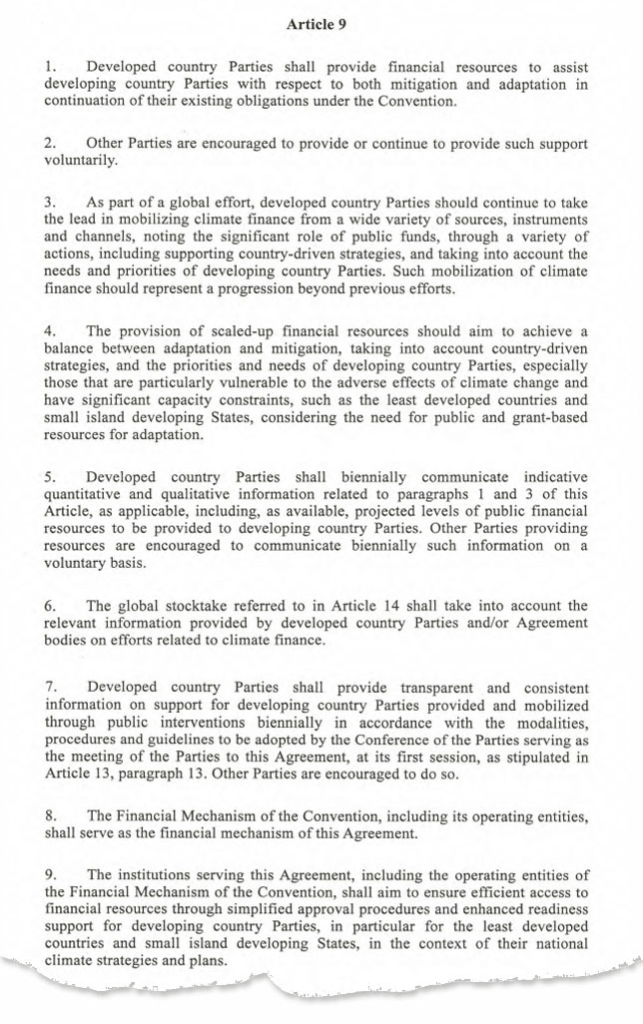
Nevertheless, private funding is allowed by the UNFCCC and Article 9 of theParis Agreement(below) references “mobilising climate finance from a wide variety of sources, instruments and channels” while also “noting the significant role of public funds”.
In a recentstatement, theAfrican Groupnegotiating bloc indicated that as finance is scaled up in the future, they expect most of it to come from private sources.
The OECD itself has comeunder attackfor overestimating the amount of climate finance and overlooking the concerns of “developing” countries. “The OECD, a club of rich countries, cannot unilaterally define climate finance,” says Jaiswal.
Anassessmentby Oxfam placed the total for the 2017-18 annual average at just $19-22.5bn – roughly $60bn below the OECD’s 2018 estimate.
The method used by the anti-poverty charity involves removing repayments and interest from the value of loans, cutting out private finance and scaling down figures for projects that are only partly climate-relevant.
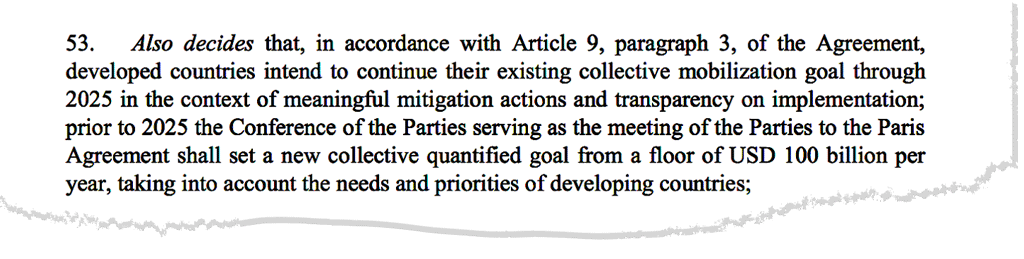
Despite missing the $100bn target – even by the most generous accounting standards – nations assembling at COP26mustturn their attention to anew finance targetfor 2025 and beyond.
The Paris text (below) says that there must be a “new collective quantified goal from a floor of $100bn per year, taking into account the needs and priorities of developing countries,” noting that nations will continue providing $100bn each year until the new goal kicks in.
Arecent assessmentprepared by the UNFCCC’sStanding Committee on Financeconcluded that developing countriesrequire$5.8-5.9tn up to 2030 in order to fund less than half of the actions outlined in their official climate plans – although some of this would be funded domestically.
This year’s negotiations are likely to spark calls for a significant scaling up of finance, although the slow pace of proceedings means that, for the time being, the focus of new goal discussions will primarily be on agreeing a framework for future talks.
Nevertheless, there are various issues that could be on the table during this next phase, including ensuring that more money is spent on adaptation.
Joe Thwaites, a climate finance expert at WRI, tells Carbon Brief that one such issue is expanding the list of climate finance providers beyond Annex II countries, to reflect the growing wealth of many nations.
However, he says such a shift would require a degree of trust in the historically “developed” countries that may be difficult to muster:
“I think it’s hard, frankly, for developed countries to ask to expand the pool of contributors when they haven’t even met the $100bn yet…I don’t doubt they will try, but they really don’t have much of a moral high ground right now to be able to start pointing fingers at other countries.”
How is climate finance distributed?
Carbon Brief has created several interactive “Sankey” flow charts to show how climate finance is being transferred around the world.
The numbers used in these charts are averages for 2018 and 2019. Using both years provides a more representative picture as it smooths out any particularly large or small donations in a given year
This is an update of aprevious analysiscarried out by Carbon Brief for the years 2015 and 2016.
The data used for these Sankey diagrams comes from the OECD. However, this is the organisation’s own “climate-related development finance” data from its 38 members, which includes detailed project-level information.
While related to the overall “climate finance” figurescitedin the previous section, Giorgio Gualberti, a development finance analyst at the OECD, tells Carbon Brief this data is different in a number of ways.
Information on bilateral funds is sourced by the OECD from its members, not from countries’ declarations to the UNFCCC, and only some private finance is included.
Moreover, the dataset includes payments from countries such as South Korea that are not mandated by the UNFCCC to provide climate finance. It also includes donations to countries that areeligiblefor foreign aid, but are not part of the UN’s “mostly developing” group of non-Annex I countries, such as Ukraine.
“Provider” and “recipient” datasets are produced by the OECD, with the first focusing on money flowing from wealthier nations and the second on money flowing to countries in need. The provider total for 2018 was only $39.6bn and the recipient total was $72bn.
Thekey differencebetween the two is that the provider perspective includes bilateral country-to-country flows, plus each country’s input into multilateral institutions (A+B on the diagram below). But the recipient perspective uses the output of multilateral institutions – including additional funds raised by those institutions (A+C).
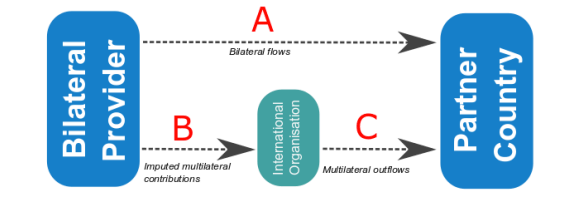
Carbon Brief has used the provider data for this analysis. While the recipient perspective provides a fuller picture of progress towards the $100bn, the dataset does not include information on which wealthy countries are responsible for each portion of multilateral funding. Thwaites tells Carbon Brief:
“The bilateral and multilateral inflows are a more accurate indication of contributor country budgetary effort, whereas the outflows are a more accurate indication of actual progress towards the $100bn goal.”
He points out that whenever a country makes a pledge – such as US president Joe Biden’srecent$11.4bn per year announcement – they will generally be talking about these “inflows”, as no single government can control what comes out of multilateral climate funds.
Provider and recipient data is also not directly comparable for a single year as money may not necessarily be distributed in the year it is given.
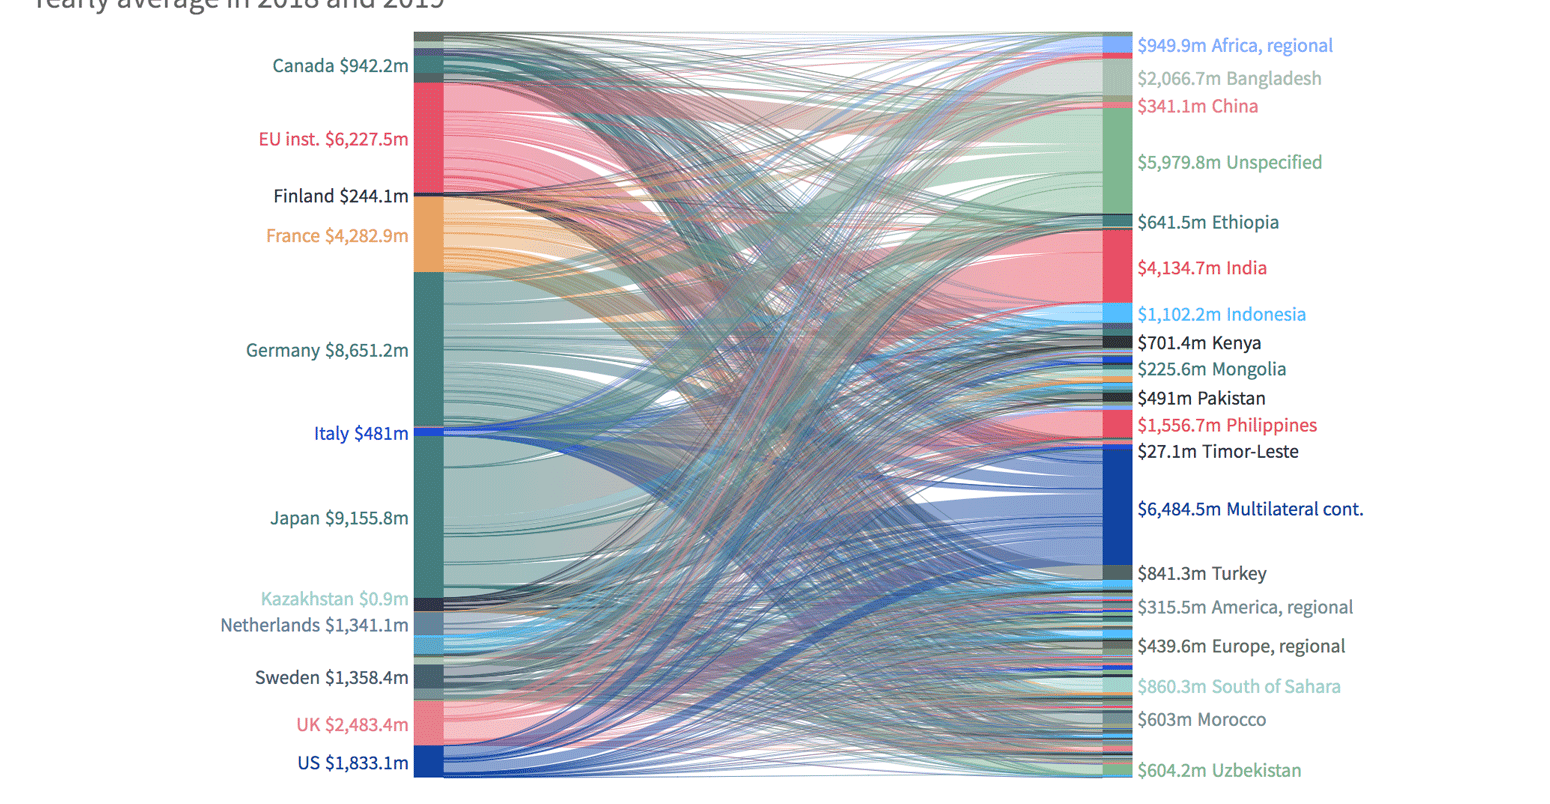
Country-country finance
This chart shows the average annual amount of climate finance provided by each OECD country for the years 2018 and 2019, which amounts to $42.3bn. It also shows where that money ended up.
OECD nations providing finance are on the left and recipient countries are on the right. The diagram also shows the amount of contributions that were made to multilateral climate funds, such as development banks or theGreen Climate Fund. (For a breakdown of which funds this money goes to, see: Multilateral contributions.)
Member countries report their climate finance figures to the OECD, based on their own assessment of what qualifies. The organisation then performs its own screening, using its “Rio markers” methodology to assess whether projects are relevant for climate change.
The top five finance providers – Japan, Germany, France, the UK and the US – have remained the same since Carbon Brief’slast analysisfor 2015/16. These five nations contributed more than 60% of the 2018/19 finance.
(The top 10 below does not include EU institutions, which would otherwise have come in third place.)
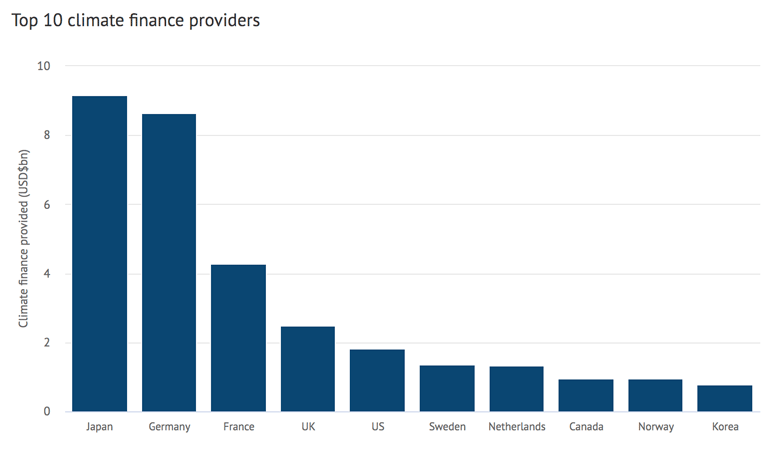
One notable development is the appearance in the top 10 of South Korea, a country that is not required by the UNFCCC to provide climate finance.
The average for the 2018/19 period for the US was about $500m lower than the 2015/6 average from Carbon Brief’sprevious analysis, after former president Donald Trumpwalked awayfrom his nation’s Green Climate Fund commitments (see: Multilateral contributions).
In itsyabo亚博体育app下载of climate finance, WRI notes that while the largest economies are among the biggest contributors, many are still not giving their “fair share”. Given its wealth and responsibility for historical emissions, the US has the biggest shortfall between the amount being given and its “fair” allocation.
As in Carbon Brief’s previous analysis, India was by far the biggest recipient of climate finance, with more than double the funds received by the next largest, Bangladesh. Japan and Germany provided about 94% of the funds to India, almost all in the form of loans.
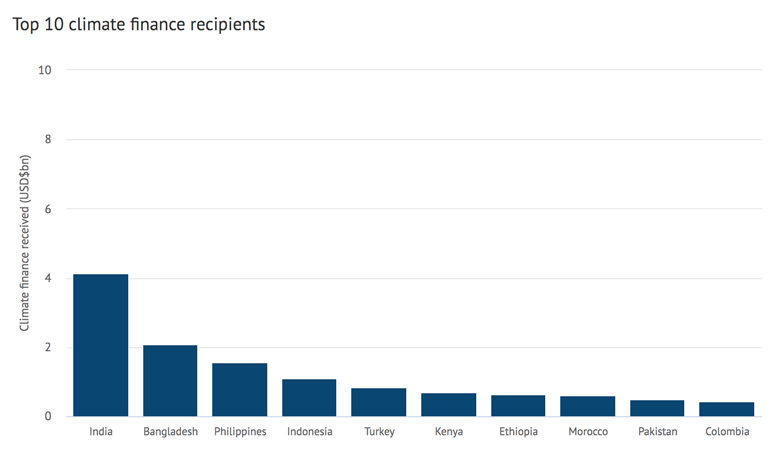
剩下的十大也在一样e 2015/16 analysis, except for Morocco, Pakistan and Colombia which replaced Vietnam, Thailand and Myanmar in the rankings. Together, these 10 nations received 30% of the 2018/19 finance.
Of this list, only Ethiopia and Bangladesh are defined under the UNFCCC as “least developed countries”,meaningthose that are particularly vulnerable to climate change and face significant barriers to sustainable development.
Multilateral contributions
This chart shows the breakdown of the $3.2bn from the first chart that flowed intomultilateral climate fundsandmultilateral development banks, as a yearly average in 2018/19.
This annual average is significantly lower than the $5.1bn recorded for 2015/16, the period covered by Carbon Brief’s last climate financeyabo亚博体育app下载.
The biggest recipient was theInternational Development Association(IDA), part of the World Bank that has the stated intention of helping “the world’s poorest countries”.
Meanwhile, the Green Climate Fund – which was set up specifically to raise money towards the $100bn target – saw a shortfall of around $1bn compared to the 2015/16 period. This can be explained in part by the USwithdrawingits support for the fund in 2018 under former president Donald Trump.
These multilateral funds play an important role in achieving the overall $100bn target, as money provided to them by wealthy nations can be used to leverage additional funds that will then flow into poorer nations to fund climate-related measures.
(This is why the total of country-to-country and multilateral outflows, A+C in the figure above, is higher than the total of country-to-country and country-to-fund flows, A+B.)
据Thwaites说,这也意味着承诺s made by countries that hold outsized influence in these international institutions, such as the US, will ultimately amount to far larger sums than those that are reported. (HisWRI analysistraced some of these outflows from multilateral development banks back to the original donor countries.)
Adaptation vs mitigation
Much of the climate finance reported to the OECD is defined as being either for mitigation or adaptation purposes, as shown in the third Sankey diagram.
减排项目应该主要侧重于削减ting emissions – for example, by building solar panels. An adaptation project, meanwhile, would focus on protecting against the impacts of rising temperatures, such as flooding.
Some projects are identified as having “overlap” between mitigation and adaptation. These funds are categorised as covering both goals in the diagram. Others are not identified as being for either mitigation or adaptation and are labelled as “no info”.
TheParis Agreementspecifies that climate finance should aim for an even split between these two categories, but funding haslong beenskewed towards mitigation. According toJan Kowalzig, a senior policy adviser at Oxfam, governments often tend to view such projects as more attractive investments:
“Since [mitigation projects] often have to do with energy, they seem to be more directly linked to a country‘s development, even though, of course, this is a huge misconception given the central (but, for politicians, often less visible) role of adaptation.”
约400亿美元的平均perio 2018/19d, 39% of money went on mitigation, while just 25% went on adaptation – a slightly more even split than was recorded in Carbon Brief’sprevious analysisfor 2015/16.
However, other estimates, including the OECD’s ownclimate finance report, suggest a more pronounced split, with around three times as much finance going to mitigation than adaptation in 2018 and 2019.
This imbalance is a major concern amid rapidly escalating climate costs. TheUN Environment Programmeplacescurrent annual adaptation costs for “developing countries” at $70bn, but says they will reach $140-300bn by 2030.
Ensuring adequate adaptation finance in the coming years is, therefore, seen by many vulnerable nations as a key priority for post-2025 climate finance plans as they are developed.
Grants vs loans
This diagram above shows the breakdown of climate finance by type of “instrument”. The categories are set out by the OECD and are broadly divided into grants and debt instruments, such as loans and reimbursable grants.
While there are far more grant-based projects included in the database, they tend to be worth a lot less than loans. Overall, 57% of the roughly $40bn in finance assessed here is provided as grants, while 39% of projects are financed using debt instruments.
As in previous Carbon Brief analysis, some of the countries with the largest contributions, specifically Japan and France, provide virtually all of their finance in the form of loans.
This is potentially highly significant.yabo亚博体育app下载by Oxfam found that only a fifth of all reported public climate finance for 2017-18 was in the form of grants. It calculated that the “true value of the loans once repayments and interest are deducted” for this period was less than half the amount reported.
While loans for clean energy projects might make sense in a wealthy nation such as Germany, Kowalzig tells Carbon Brief they areless usefulfor poorer countries:
“In a poverty-stricken country in the global south, projects may be much less profitable because society may not be able to generate enough revenue that can be recycled back to a lender without increasing debt levels of that country.”
Moreover, Kowalzig says that loans have “limited use” when funding adaptation measures. “Maintaining food or water security or protecting people from extreme disasters usually does not offer profit-making at all,” he adds.
Climate significance
Much of the aid money that goes to tackling climate change is not for that purpose alone. For example, a grant might primarily benefit public health or water supply, but also has some kind of climate component.
There are discrepancies around how to account for funds that are only partly climate-related, with different organisations giving them different weightings when they add up climate finance.
The chart above shows the split in different kinds of climate aid spending under the OECD system, as defined using the organisation’s “Rio markers”.
“Principal” projects are ones where addressing climate change is the main priority. “Significant” projects only include climate as a secondary impact.
As the chart above shows, “significant” contributions that are less relevant for climate action dominate.
For the 2018/19 average, which amounts to around $40bn, 56% of the funding is “significant” compared to 28% which is “principal” climate finance. The remainder flows into multilateral climate funds.
OECD member nations use different factors to scale down the value of a project they count in these figures if climate is not the main priority. Some do not scale it down at all. The OECD itself does not scale down funds that are only “significant”.
In contrast, when both the UNFCCC itself and also Oxfam assess less climate-relevant funds, they tend to adjust them downwards by at least half. This has important implications for both the total finance reported and also the ratio of grants vs loans and adaptation vs mitigation.
Sankey diagrams by Joe Goodman for Carbon Brief.