Analysis: Cutting the ‘green crap’ has added £2.5bn to UK energy bills
Simon Evans
01.20.22Simon Evans
20.01.2022 | 7:16amEnergy bills in the UK are nearly £2.5bn higher than they would have been if climate policies had not been scrapped over the past decade, Carbon Brief analysis shows.
The changes includedguttingenergy-efficiency subsidies,effectively banningonshore wind in England andscrappingthe zero-carbon homes standard. They were introduced after a November 2013Sun frontpagereported that then-prime minister David Cameron’s answer to rising energy bills was to “get rid of the green crap”, meaning to cut climate policies.
With UK energy bills set to rise by around 50% from current levels in April, the government is once againscramblingto find ways to mitigate the impact on struggling households.
Ideasbeing briefed to the press includefurther cutsto energy efficiency policies,cutting VATon energy bills,getting ridof renewable subsidies or governmentpaymentsto energy suppliers.
Carbon Brief’s analysis shows that previous efforts to slash climate policies are now costing the average household around £40 per year, rising to £60 under the price cap expected next winter.
Instead, separate Carbon Brief analysis shows that nearly 90% of the increase in bills over the last year is due to therising price of gas, which has more than tripled over the same period.
Most of the remaining expected increase in bills is due to thecostof energy suppliersgoing out of business, whereas climate policy costs have already fallen and are due to drop further.
Update 2pm: The analysis below does not include solar, which was alsoexcludedfrom government support in 2015. If a plausible 5 gigawatts (GW) of additional solar capacity had been built since 2015, bills would be aroundanother £0.5bn lower, or roughly £7 per household.
‘Green crap’
The last time energy bills routinely hit UK front pages was in 2013, when high gas prices saw then-opposition Labour leader Ed Miliband pledge tocap energy billsif he won the next election.
Later that year, aSun frontpagereported then-prime minister David Cameron’s “solution to soaring energy price[s]” with the headline: “Get rid of the green crap.”
THE SUN FRONT PAGE: Get rid of the green crap#skypaperspic.twitter.com/6URkZK654O
— Sky News (@SkyNews)November 20, 2013
Cameron’s government, in coalition with the Liberal Democrats, went on to make a series of changes, includingcutting spendingon energy-efficiency improvements and introducing the “green deal” efficiency scheme, laterdescribedby theNational Audit Officeas a “fail[ure]”.
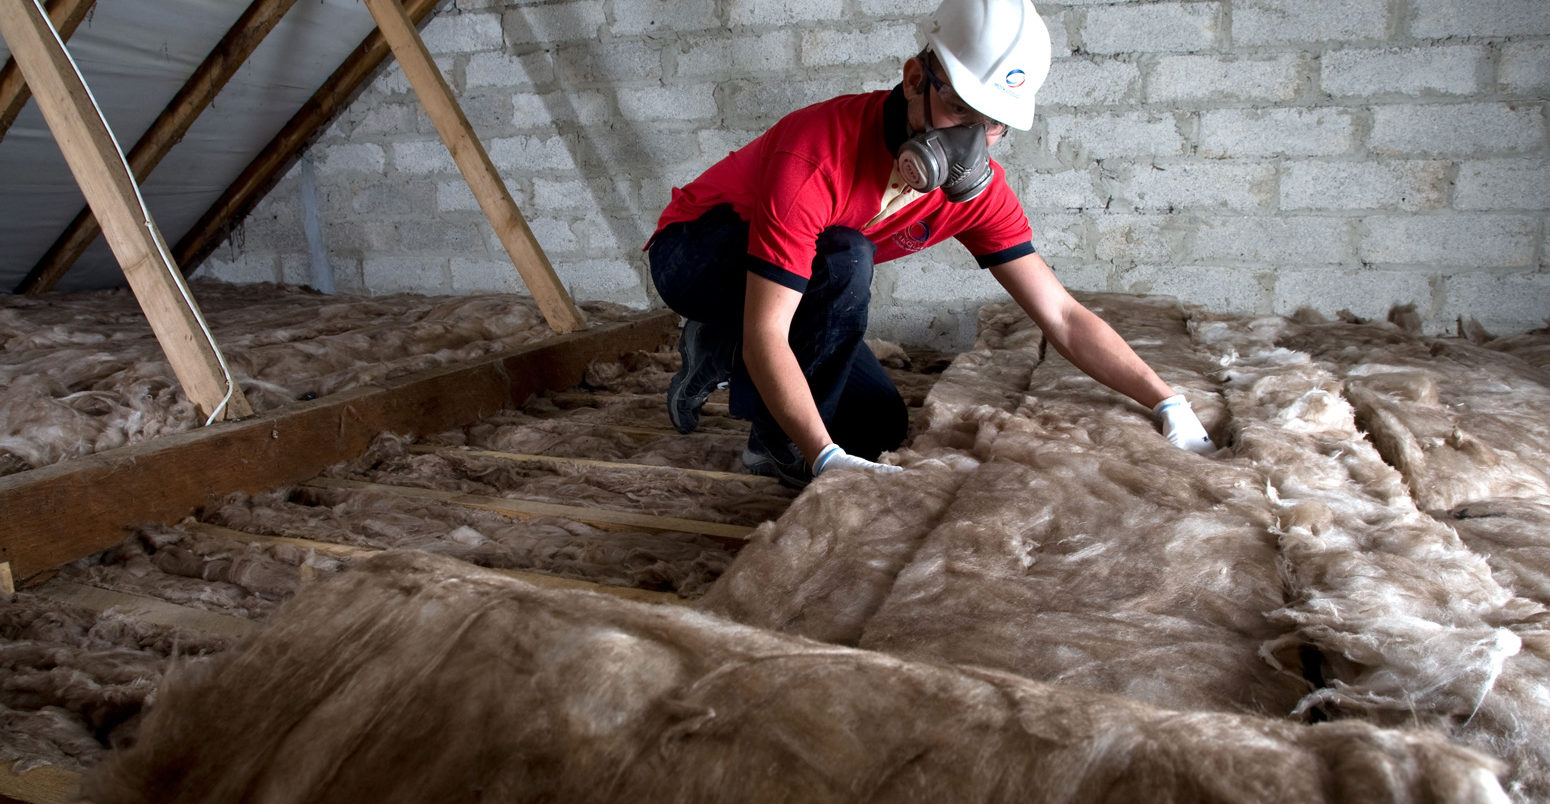
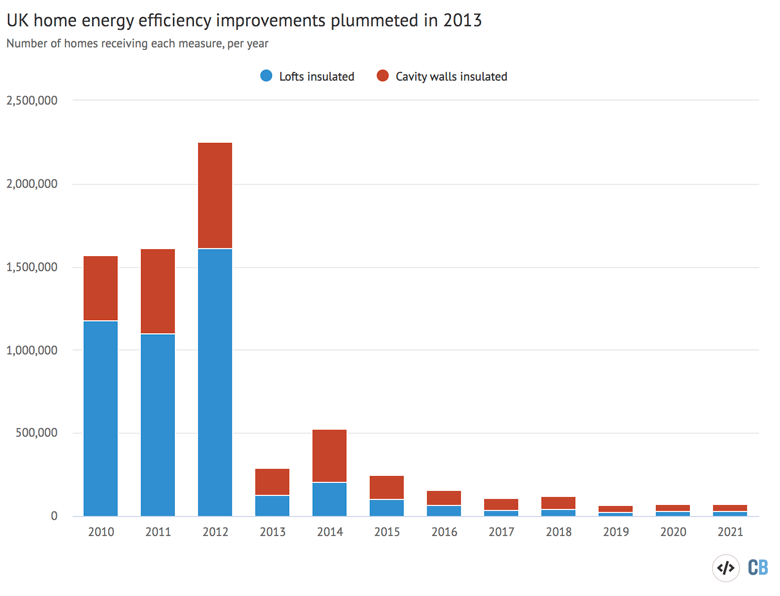
The number of homes getting their lofts or cavity walls insulated each year plummetedalmost immediately– by 92% and 74% in 2013, respectively – and has never recovered.
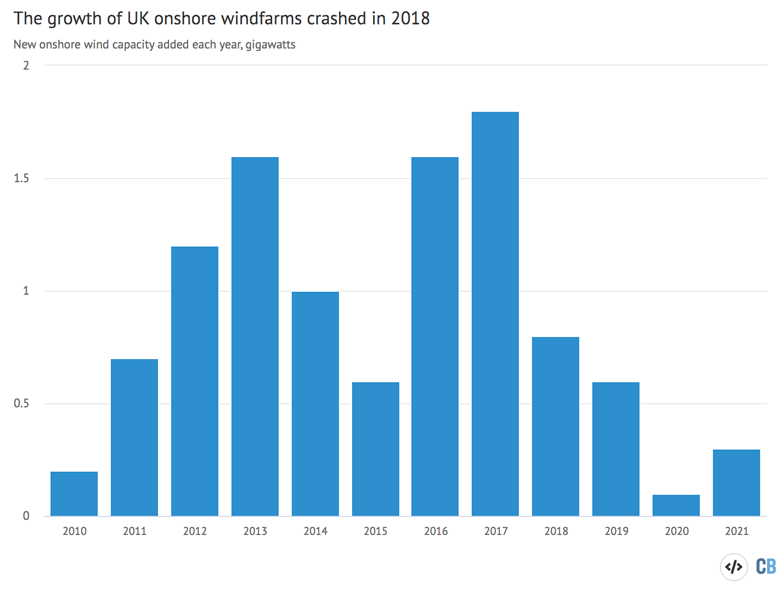
In 2015, the Conservative administration thenended subsidiesfor onshore wind and introducedplanning reformsin England that, together, were widely viewed as a “ban” on the technology.
Following a grace period for projects then already in the pipeline, the capacity of onshore windfarms being completed in the UK each year dropped dramatically after 2017.
Finally, the Conservative government in 2015 alsoscrappedthe zero-carbon homes standard, which had been due to come into force the following year. As a result, around a million new homes have been built since then with lower energy-efficiency standards – and higher energy bills.
The combined impact of these changes means UK energy bills are now around £2.5bn higher than they would have been if the “green crap” had been kept in place, Carbon Brief analysis shows (see methodology, below). This is illustrated in the chart below, which shows how the impact will change under the expected energy price caps for summer 2022 and winter 2022.
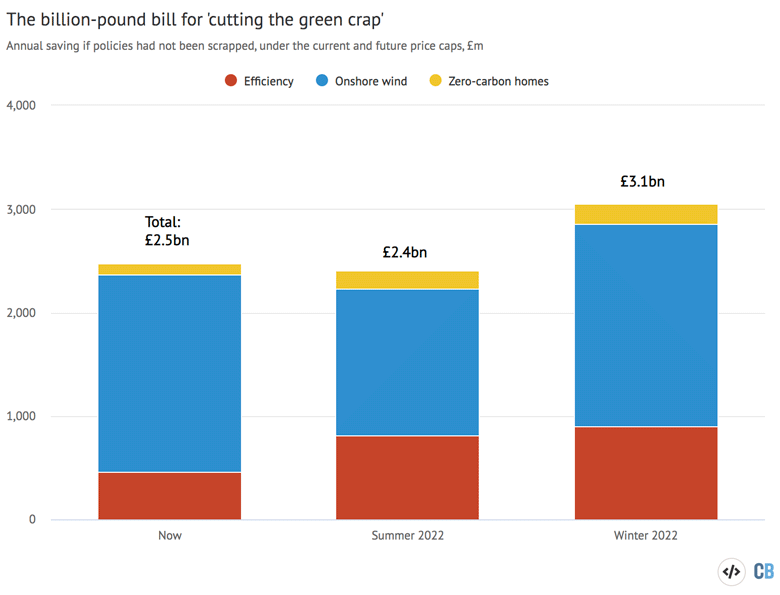
The £2.5bn saving would have translated into reductions of around £40 per household under the current price cap, given homes making up a third of UK electricity demand. This would have risen to £50 and £60 under the expected price caps for summer and winter 2022, respectively.
Business and industry – which use two-thirds of UK electricity – would also have benefitted, saving around £1bn of the total thanks to lower power prices.
(Maintaining these climate policies since 2013 would have come with a cost. However, the small costs of meeting the zero-carbon homes standard would have been paid by developers or higher house prices rather than bills. Onshore wind CfDs would currently be a net saving on bills and most lofts and cavity walls would now have been insulated.)
Gas prices
这些假设的储蓄,如果气候政策哈d been kept in place, can be compared with the expected increase in UK household energy bills when the current cap increases on 1 April.
The cap is set by energy regulatorOfgemevery six months on the basis of a complex combination of wholesale energy marketfuturespricesand other measures, with the level of the next cap due to be announced on 7 February.
Widelyreportedestimates from a range of consultancies suggest the cap will increase by around 50% or more for summer 2022, rising again to more than £2,000 a year under the winter 2022 cap.
Estimates from financial services firmInvestec Securities, with Carbon Brief analysis, suggest the cap will rise from the current level of £1,277 per year for a household with typical energy consumption, to £1,907 this summer and to £2,124 under the winter 2022 cap.
This is an increase of more than £600 per household per year in April, with another £200 on top of that when the cap is revised again in October 2022. By then, bills will have doubled in two years.
The past and expected future change in the annual UK household energy price cap are shown in the chart, below, which breaks down the total into its component parts.
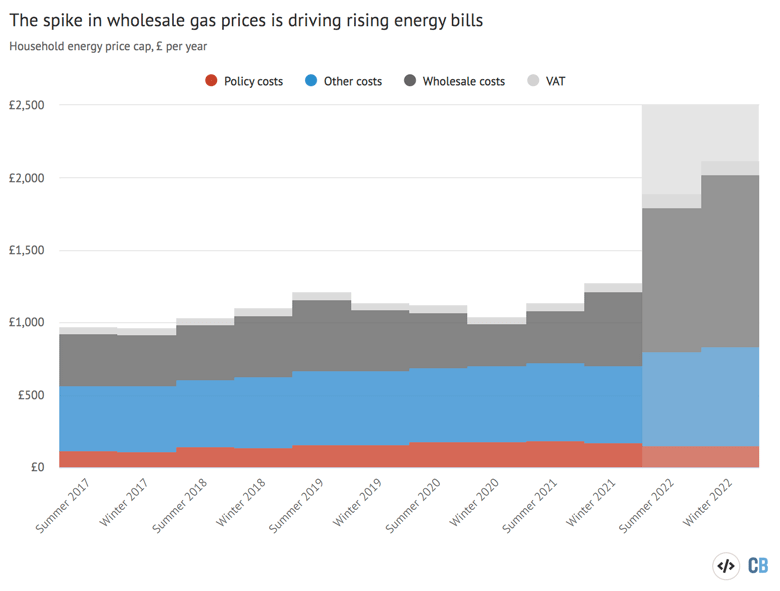
Crucially, the increase in the UK household energy price cap is overwhelmingly being driven by rising wholesale gas prices, which have surged not only in the UK but around the world.
In a recentLinkedIn post,International Energy Agencyexecutive director Fatih Birol emphasised that the current “storm” in energy markets is first and foremost a “natural gas crisis”. Birol wrote:
“Unfortunately, we are once again seeing claims that volatility in gas and electricity markets is the result of the clean energy transition. These assertions are misleading to say the least. This is not a renewables or a clean-energy crisis; this is a natural gas market crisis.”
Carbon Brief estimates that 87% of the increase in the UK cap this April, relative to a year earlier, will be due to wholesale prices, with most of the remainder due to the cost ofsupplier failure(this is included under “other costs” in the chart above).
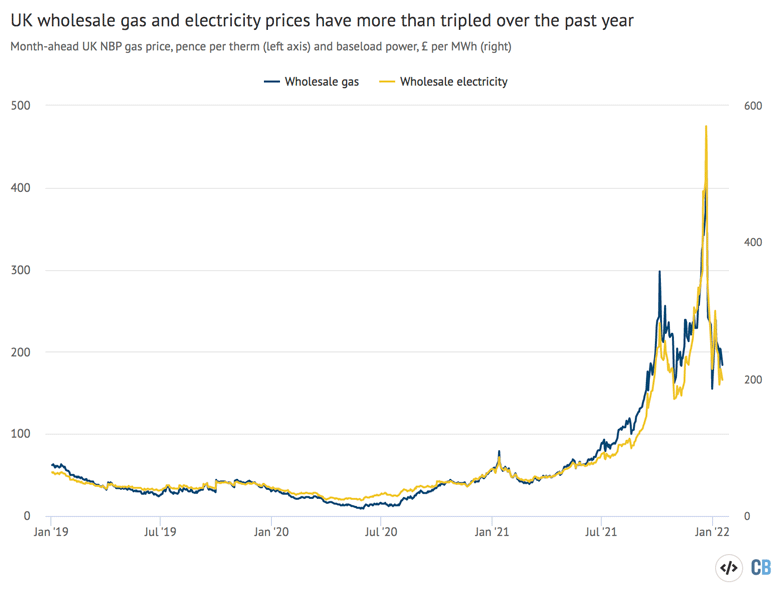
Over the past year, UK wholesale gas prices have more than tripled, as shown by the blue line in the chart, below. This hasdrivena similar increase in wholesale electricity prices (yellow).
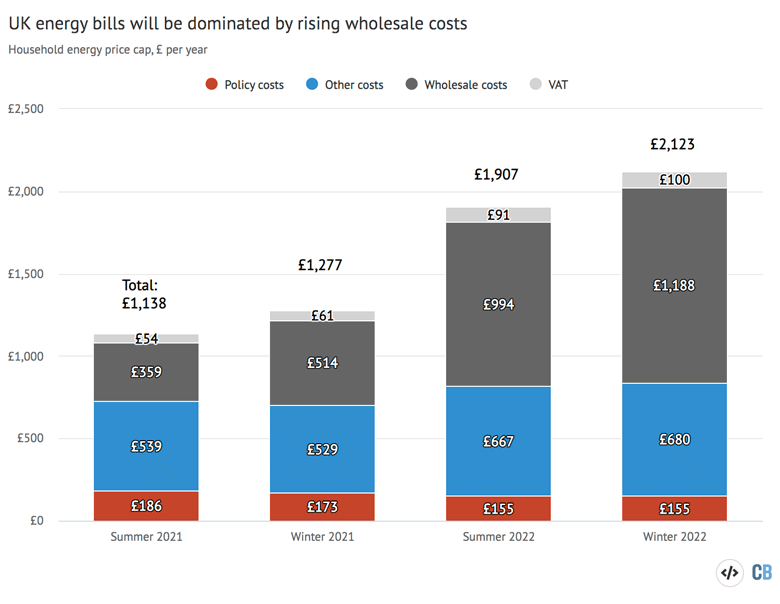
Looking at the UK household energy price cap more closely only serves to emphasise the decisive role of wholesale costs. The chart below shows these costs are due to more than triple from £359 per year under the summer 2021 cap to £1,188 in winter 2022, an increase of more than £800.
In contrast, policy costs have already fallen from £186 on an average bill under the summer 2021 price cap to £173 in the current period (red chunks). They are expected to drop even further in the next two price cap periods, covering summer 2022 and winter 2022.
Removing VAT on energy (around £100 a year) or paying policy costs via general taxation (around £150) would have a relatively small impact on bills – even in combination – compared with the expected increases due to wholesale prices.
Even if renewable subsidies were taken off bills it would be difficult to cut them, as they are based onlegal contractsbetween the government and developers. Instead, they could be paid for via general taxation, which is generally agreed to beless regressivethan energy bills.
In any case, policy costs are currently falling due to the design of the “contracts for difference” (CfDs) that are now the main way of supporting clean electricity generation in the UK.
Each project with a CfD receives a fixed “strike price” for any electricity it generates. If wholesale prices are below the strike price, the difference is made up with a subsidy, paid via a levy on bills. If wholesale prices rise above the strike price, then the project pays back the difference.
In effect, this means CfDs are not only a subsidy for low-carbon electricity, but also ahedgeagainst high gas prices. The UK’s portfolio of CfD-backed projects paid back to billpayers for thefirst timeever last September and isprojectedto continue doing so for the rest of this year.
This means that whereas CfDs had been costingaround £30on an average annual household bill, they will instead offset some of the large increase in wholesale costs while gas prices remain high.
(Investec的预测包括波利奇的减少y costs of £31 between the summer 2021 cap and the expected level in summer 2022. If high electricity prices aresustained, as marketscurrently predict, then the CfD saving could be larger. On the other hand, Investec’s forecasts do not include small expected increases in the cost of theEnergy Company Obligation(ECO) energy efficiency scheme and theWarm Home Discount(WHD) that supports vulnerable households.)
Other options being discussed to manage the increase in bills include the government using the WHD or benefits tooffer highersupport to a larger number of households,deferringthe costs of supplier failure orpaying energy suppliersto smooth out spikes in wholesale prices.
Chancellor Rishi Sunak isreportedto be preparing a package of support that he will announce at the start of February, just before Ofgem announces the level of the summer 2022 cap.
Methodology
Carbon Brief’s analysis of the impact of having “cut the green crap” is based on a series of assumptions about what would have happened if those policy measures had remained in place.
It aggregates the impact in terms of kilowatt hours (kWh) of gas that would have been saved by homes across the UK, relative to currentdomestic demand, as well as the amount and price of electricity that would have been generated from extra onshore windfarms.
The estimate assumes that the rate of loft and cavity wall insulation would have continued at therate seen in 2012. As a result, allremaininguninsulated lofts – and most cavity walls – would have been completed by 2021.
The analysis assumes that homes insulating their lofts or cavity walls would have reduced their gas usage fromtypical levels, by 6% or 12% respectively, based onyabo亚博体育app下载from University College London for theClimate Change Committee(CCC).
This gives similarfigures, in terms of kilowatt hours (kWh) of gas saved, to the latestNational Energy Efficiency Data-Framework(NEED), which reports the actual impact of home improvements in a sample of thousands of properties.
The estimate for the zero-carbon homes standard is based onfiguresfor the energy use and floor area of new homes from the thinktank theEnergy and Climate and Intelligence Unit(ECIU) and thenumber of homesbuilt since 2015 from theOffice for National Statistics(ONS).
The estimate for onshore wind assumes新能力would have continued to be added at the same rate as in 2017, when 1.8 gigawatts (GW) was built. In total, this would have meant an extra 5.4GW being built by the end of 2021.
This capacity is assumed to have generated electricity at a load factor of 31% and cost of £50 per megawatt hour (MWh) in 2012 prices, based on a2017 reportfrom consultancyBaringa. The cost was converted to current prices using theTreasury GDP deflator.
The energy savings and cheaper electricity that would have occurred with the “green crap” in place is converted to bill impacts today, based on the current and forecast future price cap, unit costs and wholesale electricity prices.
The saving due to onshore wind generation is allocated to the UK’s roughly27 million homesand other electricity users according to their current share ofoverall demand, roughly one to three.