
Analysis: China’s CO2 emissions hit Q1 record high after 4% rise in early 2023
Multiple Authors
05.12.23Multiple Authors
12.05.2023 | 12:01amChina’s carbon dioxide (CO2) emissions grew 4% in the first quarter of 2023, reaching a record high for the first three months of the year.
The new analysis for Carbon Brief, based on official figures and commercial data, shows the increase was driven by an economic rebound after the end of China’s long zero-Covid policy, stimulus measures and weak hydro generation due to an ongoing drought.
Looking at the rest of the year, the government’s focus on economic growth means that China’s emissions are likely to reach an all-time high in 2023, topping the previous peak in 2021.
The medium-term picture is less clear. The first quarter of 2023 saw further approvals for new coal power capacity, after a sharp increase last year. In the same period, additions of wind and solar capacity both reached record highs, with nuclear also accelerating.
The growth of low-carbon energy means new coal capacity is not guaranteed to raise China’s emissions – and recent high-profile criticism could mean more scrutiny of coal expansion.
The rapid expansion in low-carbon energy, if sustained, could enable emissions to peak and enter structural decline, once the post-Covid recovery has played out.
- China’s CO2 emissions hit record for Q1
- Why China’s CO2 emissions went up
- China hits symbolic clean-energy milestone
- China’s new wave of coal power continues
- What do China’s new coal plants mean for emissions?
- What is the outlook for China’s emissions in 2023?
- Data sources
China’s CO2 emissions hit record for Q1
The new analysis shows that China’s CO2 emissions grew 4% in the first quarter of 2023, compared with a year earlier. This means first-quarter emissions were the highest on record, exceeding the previous peak reached in the first three months of 2021.
The first quarter of each year is highlighted red in the figure below, which also illustrates the yearly cycle in China’s emissions. (The first quarter usually has the lowest emissions each year, as it includes the annual Chinese New Year celebrations.)
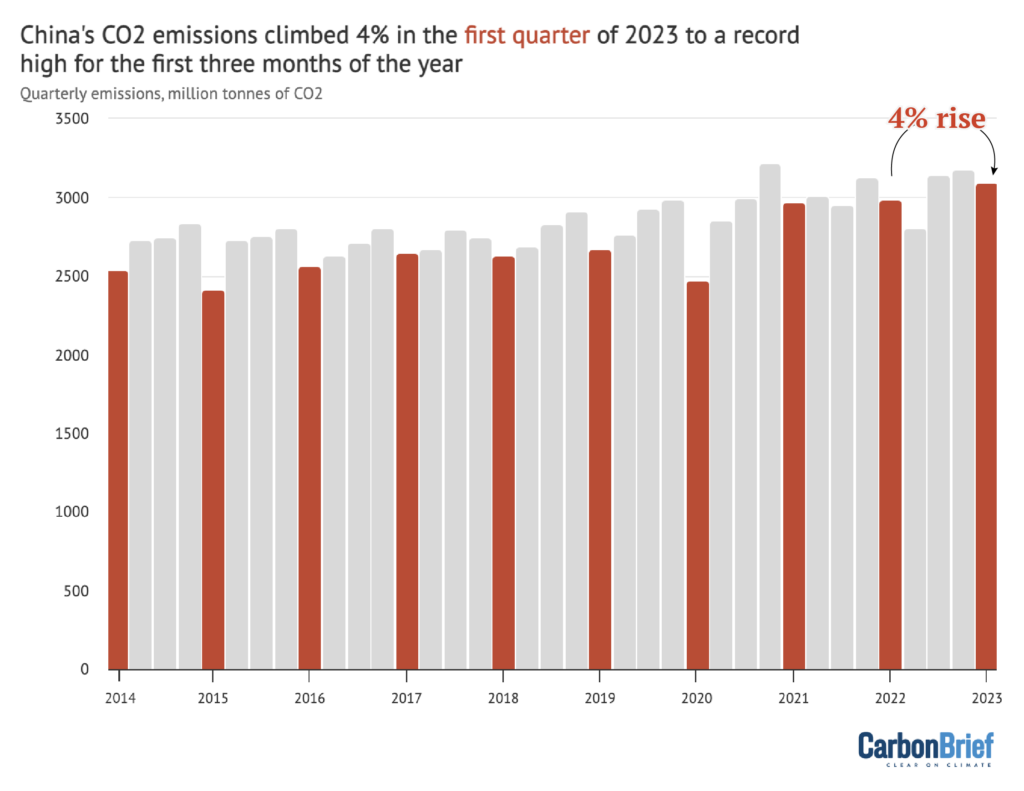
Emissions increased due to rising demand for fossil fuels, with oil consumption up 5.5%, coal by 3.6% and gas by 1.4%, while cement production climbed 4.1%.
There are multiple reasons for these increases, including a rebound in the economy after the end of China’s zero-Covid policy, government financial stimulus for manufacturing and infrastructure construction, as well as an ongoing collapse in hydropower generation due to low rainfall.
(There was a difference in the change in CO2 emissions in the first quarter calculated from apparent fuel consumption and changes in consumption reported by the National Bureau of Statistics, with the first approach giving a year-on-year increase of 5.7% and the second approach 3.8%. The difference was almost solely due to differing coal consumption growth rates, of 5.9% and 3.6%, respectively. Such differences are typical for preliminary data.)
Why China’s CO2 emissions went up
Looking at specific sectors, the largest contributor to rising emissions was electricity generation – as shown in the figure below – where power output from coal increased by 2%.
China’s CO2 emissions in the first quarter of 2023, broken down by sectors. Emissions are estimated fromNational Bureau of Statistics dataon production of different fuels and cement,China Customs dataon imports and exports andWIND Informationdata on changes in inventories, applyingIPCCdefault emissions factors andannual emissions factorsper tonne of cement production until 2019. Monthly values are scaled to annual data on fuel consumption inannual Statistical Communiquesand National Bureau of Statistics annual Yearbooks. Chart by Carbon Brief usingHighcharts.The increase in coal-power output came despite relatively limited growth in electricity demand, which grew by 3.6% compared to the same quarter a year earlier.
Coal power grew regardless, due to ongoing poor hydro output, which has beenfallingdue to droughts and low rainfall sincesummer 2022.
If hydro generation had been at average levels, coal power would have fallen slightly. Moreover, the overall rise in China’s emissions would have been 0.6 percentage points slower.
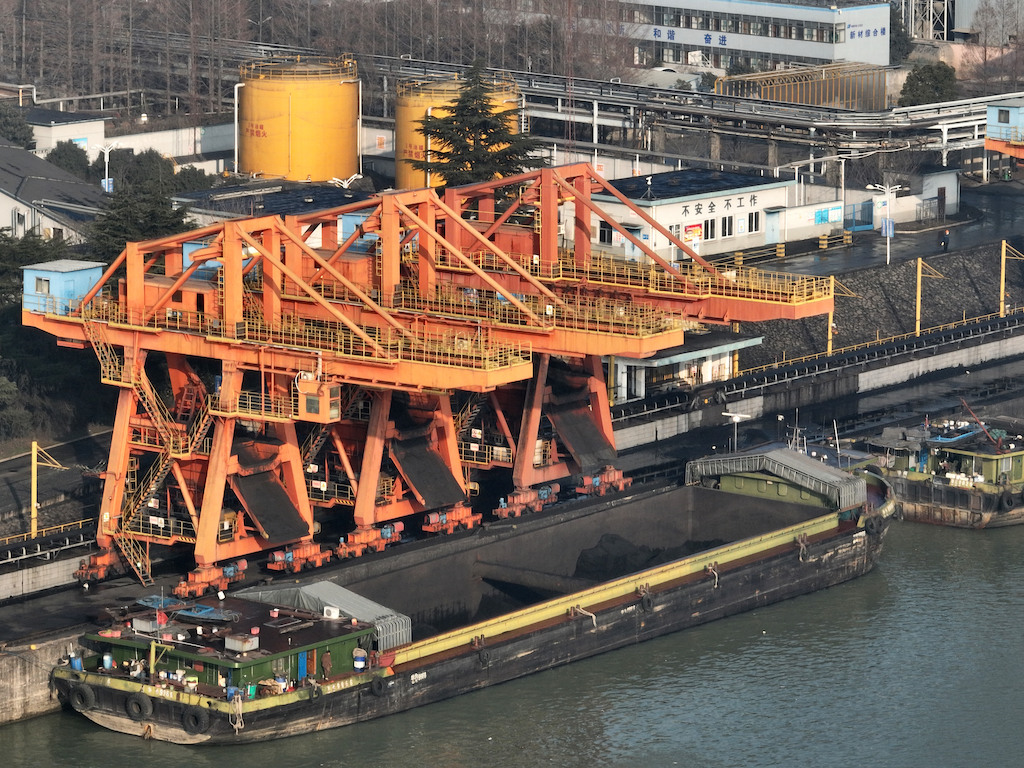
Since 2021, China has been making major efforts toboost domestic coal productionin the name of energy security. Productionreportedlygrew 11% last year. Despite higher domestic supply, however, China’s coal importsnearly doubledin the first quarter of 2023.
As noted in CREA’sprevious analysisfor Carbon Brief, the expansion of domestic mining was accompanied by a sharp fall in the average calorific value of coal produced in China, meaning each tonne contained less energy.
Thisdegraded qualityof domestically produced coal, combined with rising demand for the fuel, led to the increase in imports during the first three months of this year.
The ongoing need for imports shows the limits of the government’s energy security push. It alsoweakens国内煤炭迷你的经济竞争力ng and power generation, as the targeted reduction in prices and increase in supply of domestic coal fails to materialise, despite major investments and efforts.
Electricity demand growth was driven by industry, where consumptionincreasedby 4.4% and accounted for 78% of the rise overall.
With China ending its zero-Covid policy, the demand for electricity from the service sector also increased, as people spent more time in offices, public and commercial spaces. At the same time, household power demand fell, as people spent less time at home.
The second-largest reason for the growth in emissions was higherproduction volumesof construction materials, mainly steel and cement, which increased 6% and 4% respectively across the first three months of the year. In March, this growth accelerated to 7% and 10% respectively.
The rise in heavy industry output and emissions have causedconcernsover a rollback of the air quality improvements made in recent years, especially in the capitalBeijing.
The Chinese government did not issue any air pollution action plan last winter, for the first time since 2017. These plans have included restrictions on heavy industry output. The lack of a plan wasreportedlyseen as a signal that industrial output took precedence over air quality.
The third-largest factor was greater use of oil products, whichincreased6.5% driven by resumption of transportation activity. Jet fuel consumption, in particular, rebounded sharply as a result of the end of China’s zero-Covid policies. This was to be expected, as zero-Covid haddepressed航空旅行卷在过去年压裂tion of pre-pandemic levels.
China hits symbolic clean-energy milestone
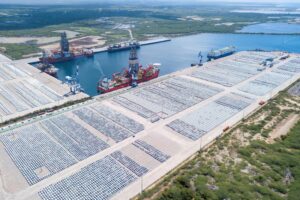
While China’s emissions increased again in the first quarter of 2023, the country also passed a symbolic milestone for the capacity of electricity generation from non-fossil sources.
These sources, including renewables and nuclear,passed50% of China’s installed power capacity for the first time, overtaking coal and other fossil fuel-based capacity.
Solar installationsincreasedto a record 34 gigawatts (GW) in the first three months of the year, nearly tripling the previous high of 13GW in the same period of 2022. (For comparison, total UK solar capacity has been stuck ataround 13GWfor the past five years.)
New wind power installations also reached a record for the first quarter. The 10.4GW added in the three months to March 2023 was an increase of 32% over the period in 2022.
These records for wind and solar are shown in the figure below.
Meanwhile, nuclear power plant approvals and construction have also sped up. By the end of 2020, China had50GWin operation and16GWunder construction.
With 27GW of capacityunder constructionand 57GWin operation, the country is on track to have 70GW in operation and 30GW under construction by 2025.Tworeactors have started construction andonehas started generating electricity this year.
New power generating capacity additions, GW, shown as cumulative totals year-to-date. Source: China Electricity Council data via WIND Financial Terminal. Chart by Carbon Brief usingHighcharts.For 2023, China is targeting160GWof new wind and solar capacity. It beat its target of120GWfor 2022, installing125GWby the end of the year.
如果160千瓦的目标是满足,额外capacity would generate enough to cover a 3% increase in China’s electricity demand. Demand growth is likely to be even larger in 2023, due to the economic rebound and government stimulus, meaning coal power output will also increase.
However, the growth in low-carbon supplies is accelerating towards the long-term rate of electricity demand growth. When low-carbon power growth matches – and then exceeds – the annual increase in electricity demand, the sector’s CO2 emissions will peak.
An important part of China’s strategy to scale up wind and solar is building large “clean energy bases” in the country’s desert regions, abandoned coal mines and other marginal land.
CREA’searlier analysisfor Carbon Brief found that such bases were going to enable China to meet its 2030 wind and solar capacity target years earlier than planned.
These bases are being developed in a series of batches, the first two of which included97GWand200GWof capacity to be completed by 2025. Essentially all of the projects in the first batch, published in 2021, havereportedlyalready started construction. In the first quarter of 2023, the list of new projects for the third batch of clean energy bases wasapproved.
To achieve the various wind and solar ambitions of central and local governments, including the clean energy bases, annual capacity additions will need to continue accelerating in 2024-25.
CREApreviously compiledthe plans for a total of 570GW of new wind and solar capacity to be added during the14th five-year period(2021–25). A more up-to-dateassessmentraised this to 870GW.
If installations in 2023 reach the 160GW target, then 385GW will have been added in the first three years of the five-year period, leaving up to 240GW per year to be added in the next two years.
China’s new wave of coal power continues
Low-carbon capacity is not the only source of energy being expanded in China, however.
China saw asharp increasein planned coal power capacity in 2022, with the total amount of capacity planned to be in operation in 2030 rising by 10% (126GW) due to new project announcements, permitting decisions and re-activation of previously shelved projects.
Another 10GW of coal power projectswere approvedin the first quarter of 2023.
China’s local governments permitted approximately 100GW of new coal power capacity in2022, equivalent to 100 large coal-fired power plants and the largest wave of approvals since 2015. The amount of newly permitted capacity waved through by local officials quadrupled from 2021.
Besides permitting, other new project activity also accelerated, with 50% more construction starts and twice as much new capacity announced as in 2021.
The capacity of coal power plants that started construction in China in 2022 wassix times as largeas that of the rest of the world combined.
Perhaps counterintuitively, however, this new wave of coal power plants is not being driven by increasing annual demand for electricity. The real driver is concern about meeting peak demand.
China has seen a rapid increase in electric peak loads in recent years, with the highest recorded momentary load increasing by 210GW (20%) from 2020 to 2022.
This dramatic increase resulted from the steadily rising prevalence of air conditioners coupled with record-high temperatures in 2022, after two cooler-than-average summers.

Record peak demand, a historicdrought and heatwave, andinflexible grid management, resulted inpower shortagesin many parts of the country last summer.
These events triggered the start of the new wave of provincial government coal plant approvals, with anapparent green lightfrom the central government, evidenced by the energy regulatortargeting165GW of coal power construction starts in 2022–23.
Yet building new coal plants to cover demand peaks of just a few days or months per year is acostly and sub-optimal solution. Moreover, 50% of newly announced coal projects and 40% of construction starts last year took place in regions with ample capacity to cover demand peaks.
The Chinese energy regulatorsaidin a document published in early 2022 that no new coal power plants would be permitted if their sole purpose was bulk power generation. The evidence from the last year suggests this policy is not currently being enforced.
Local governments are making maximum use of the window of opportunity to permit new coal plants. New construction projects are aboon to local governments, boosting economic growth and increasing demand for construction materials and services from local state-owned enterprises.
Even if this new infrastructure is not fully utilised, any risks of default on the debt used to build it tends to fall to the central government, which controls the banking system.
Many new coal projects went from being announced to receiving permits, obtaining finance and breaking ground on construction within amatter of monthslast year. This left little space for scrutiny or consideration of alternatives.
Indeed, several provincespermitted or announceda round number of 10 large coal power projects, suggesting that symbolism was more important than careful planning of how much was needed.
What do China’s new coal plants mean for emissions?
Contrary to widespread perception, China’s new wave of coal power plants will not automatically translate into an increase in its coal use or CO2 emissions.
Indeed, the combination of rapid expansion of low-carbon energy supplies and expected slower electricity demand growth means China’s annual coal power output could soon start to decline.
Moreover, such an outcome is implied by president Xi Jinping’spledgethat China would reduce coal consumption during its next five-year plan period from 2026-30.
较高的煤capacit这个明显的矛盾y, but lower coal use and emissions, could come about, if a larger fleet of coal plants sees declining utilisation. This would mean the average coal plant running for fewer hours each year, reducing its profitability.
另一方面,核电站运营商和当地政府nments are expecting to generate more electricity and revenue from the newly built plants. These economic and political interests would need to be managed, if coal power output and average utilisation is indeed going to fall.
These interests could also influence how quickly China’s CO2 output falls after peaking, as well as any other emissions targets that are put in place in the future.
For example, the pressure to make use of the newly built coal power plants could trigger lobbying that could slow down China’s low-carbon energy buildout, or could encourage growth in energy-intensive industries so as to increase electricity demand.
This is what happened after theprevious waveof coal power plant permitting in 2015. Lobbyistsarguedthat the development of renewable energy had been “too fast”.
Acontractionin renewable capacity additions followed, allowing demand for coal power generation to grow and for coal power plants to increase their operating hours.
One way to maintain the economics of coal plants while cutting their running hours would be to give them “capacity payments”. These would allow plants to make money not just for the electricity that they generate, but also for the regulated capacity that they provide to the system.
The government’splanfor economic and social development in 2023 includes studying such capacity payments.
(The expectation of capacity payments could provide additional motivation for coal power groups to pursue new projects.)
The recent wave of new coal permitting has faced some high-profile criticism, most notably from Wang Zhixuan, former general secretary of theChina Electricity Council(CEC). Hecalledfor tight controls on new projects based on assessment of local needs and warned against going down the “old path” of large-scale newbuild and replacement of small units with larger ones.
Zhou Dadi, the former director general of the Energy Research Institute under China’s state economic planner theNational Development and Reform Commission(NDRC),saidin an interview that increasing coal power capacity is not the best solution to power shortages.
Zhou acknowledged that energy enterprises still rely on “traditional” energy for their core business and that they are accustomed to using familiar thermal power plants – usually coal – to solve new problems. However, he added that this would only work in the short term and could have negative impacts in the future.
Another article in theEconomic Daily, a newspaper published by China’s State Council, defended new coal power plants. However, it said the new plants should be “drip irrigation”, being installed in the places where electricity was needed the most, rather than the current “flood irrigation”.
The article also warned that excessive new coal power capacity and a corresponding decline in utilisation rates would make it harder for China to achieve its climate goals.
These high-profile criticisms could indicate that new coal projects will face more scrutiny.
What is the outlook for China’s emissions in 2023?
While the balance between low-carbon energy and coal power will take time to play out, the outlook for China’s emissions in 2023 is already clear.
Both current trends in the first quarter and domestic projections indicate that China’s CO2 emissions will increase in 2023, likely topping the previous peak in 2021.
China’s CO2 emissions in 12-month moving sum, broken down by cement, gas, oil, coking coal and steam coal. Emissions are estimated fromNational Bureau of Statistics dataon production of different fuels and cement,China Customs dataon imports and exports andWIND Informationdata on changes in inventories, applyingIPCCdefault emissions factors andannual emissions factorsper tonne of cement production until 2019. Monthly values are scaled to annual data on fuel consumption inannual Statistical Communiquesand National Bureau of Statistics annual Yearbooks. Chart by Carbon Brief usingHighcharts.China’s emissions over the last 12 months are shown in the figure below, which illustrates the rising trend as well as the previous peak in 2021.
Emissions are likely to grow this year because the government is pursuing a broad-based approach to economic recovery that seeks to boost exports, manufacturing output and construction, in addition to a rebound in private consumption.
This includes a sharp increase inbank lendingandinvestment, particularly towards traditional targets for government stimulus measures such as new manufacturing capacity, transportation infrastructure and energy production.
In the power sector, the CEC expects that barring surprises with the weather, electricity consumption willincrease by about 6%in 2023 due to the economic rebound.
The targeted wind and solar growth of 160GW will meet half of this demand growth, which still leaves space for coal power generation to grow.
Guosen Securities, a state-owned financial services company,expectscoal consumption to grow 3.5% in 2023, with a 4% increase in power generation, 3% increase in the steel industry and in building materials, and a 5% increase in the chemical industry.
The expanding wind and solar installations are, however, reaching a scale where they will likely cover long-term average growth rates in power demand, bringing an emissions peak in the power sector within reach after this year’s rebound.
As transport continues to rebound from zero-Covid, oil consumption isprojectedto increase by 5%, according to the China Petroleum Economic and Technological Research Institute (ETRI). Demand for petrol, diesel, jet fuel and other refined fuels could rise 9% and demand for gas by 5%.
One factor that could affect these expectations is that the government isreportedlyplanning to limit 2023 steel production below 2022 levels, which would mark the third year of stable or falling steel production, afterreductionsof3%and2%in 2021 and 2022.
Given that steel outputincreasedby 6% in the first three months of the year and has continued at high levels in April, this would mean a drop-off in the rest of the year.
Looking at energy demand overall,China Energy Newsexpects an increase of around 3% in 2023. After accounting for the expected increase in low-carbon energy production, this would imply a 1% increase in CO2 emissions as fossil fuels make up the difference. In contrast, the projections by CEC, Guosen Securities and ETRI imply an increase of around 4%.
Beyond 2023, a continued rapid expansion of low-carbon energy could enable emissions to peak and enter into a structural decline, once the post-Covid recovery has played out.
Data sources
Data for the analysis was compiled from the National Bureau of Statistics of China, National Energy Administration of China, China Electricity Council and China Customs official data releases, and from WIND Information, an industry data provider.
Power sector coal consumption was projected based on power generation, to avoid theissuewith official coal consumption numbers affecting 2022 data.
When data was available from multiple sources, different sources were cross-referenced and official sources used when possible, adjusting total consumption to match the consumption growth and changes in the energy mixreportedby the National Bureau of Statistics.
CO2 emissions estimates are based on National Bureau of Statistics default calorific values of fuels and IPCC default emissions factors. Cement CO2 emissions factor is based on2018 data.
对石油的消费,明显的消费计算lated from refinery throughput, with net exports of oil products subtracted.

-
Analysis: China’s CO2 emissions hit Q1 record high after 4% rise in early 2023